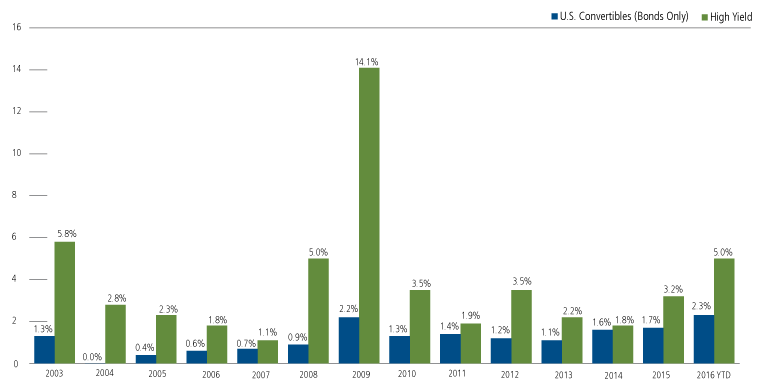
As we’ve noted in the past, the default levels for convertible securities have been low—both in absolute terms and relative to high yield. While there has been a modest increase in convertible security defaults through 2016, the overall default level remains low, according to updated data from Barclays Research. Convertible defaults have also increased less than those in the high yield market (Figure 1).
In our May post “Convertible Defaults Remain Muted,” we shared our expectation that energy issues would likely account for the bulk of the near-term defaults, which has proven to be the case as commodity prices have come under pressure. Outside of a single issuer in the alternative energy related portion of the technology sector, the technology and health care sectors we generally favor have been largely immune from defaults in 2016.
Where are convertible defaults likely to go from here? We expect them to remain comfortably below those in high yield and would note that there are important differences between the compositions of the markets. For example, the convertible security market includes a smaller proportion of energy issuers and more growth-oriented health care and technology issues. This is because the high yield market tends to be less open to companies in growth sectors that don’t have long histories of generating cash, but relatively more open to companies with longer track records—even if balance sheets are weaker.
Figure 1. Defaults in Convertible Market Remain Low
Aggregate Default Rate (%), 2003-Mid June 2016

Past performance is no guarantee of future results. Source: Barclays Equity Research, June 22, 2016, using data from Barclays Research and Moodys. Excluding preferreds and mandatories.
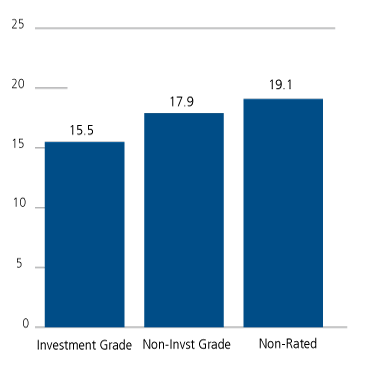
Even with default rates trending higher off their recent lows, the case for the asset class remains intact, particularly for experienced managers. In this enviroment, we believe our independent and comprehensive capital structure research provides an important edge. Barclays data shows that aggregate defaults of investment grade, non-investment grade and non-rated convertible security issues are not as dispersed as might be expected (Figure 2). In my view, this emphasizes the potential value of proprietary credit analysis—especially as non-rated credits make up approximately 50% of the U.S. convertible market and global convertible markets.
Figure 2. Aggregate Defaults by Credit Ratings
All U.S. Convertible Structures ($ bn), 2003-Mid June 2016

Past performance is no guarantee of future results. Source: Barclays Equity Research, June 22, 2016, using data from Barclays Research and Moodys.


