With Soaring Global Convertible Issuance as the Backdrop, CXGCX Outperformed Equity and Convertible Markets
July 27, 2020
Portions of this commentary previously published in thought leadership by Founder, Chairman, and Global CIO John P. Calamos, Sr. and Co-CIO Eli Pars.
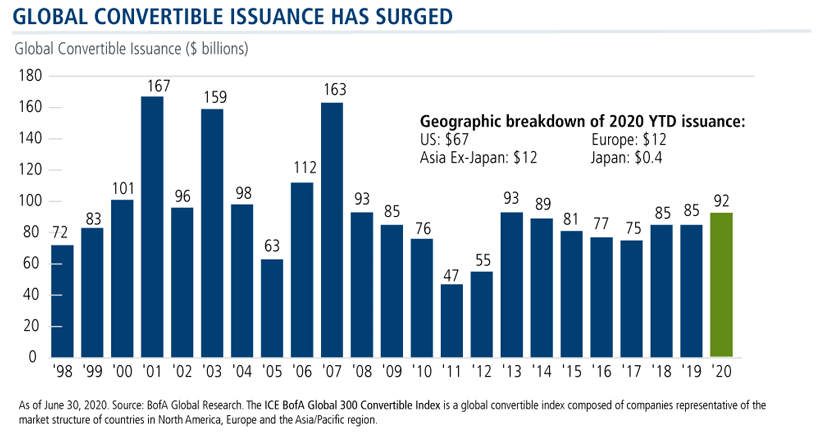
Global convertible issuance has soared since the equity market correction in March as companies have sought to access capital in order to shore up liquidity. Global companies have brought nearly $92 billion in convertible issues to market through June, including a surge of more than $70 billion since the end of the first quarter. In June alone, global companies issued more than $27 billion.
Convertible issuers represent a very diverse group of companies. The convertible market is typically dominated by companies in growth-oriented sectors, but the recent flurry of issuance has also included larger consumer companies and cyclicals. Recent issuers include many household names, and many deals have come to market with favorable terms and very attractive pricing. Year-to-date, the U.S. has led global issuance, but Europe and Asia ex-Japan have produced strong issuance markets as well.
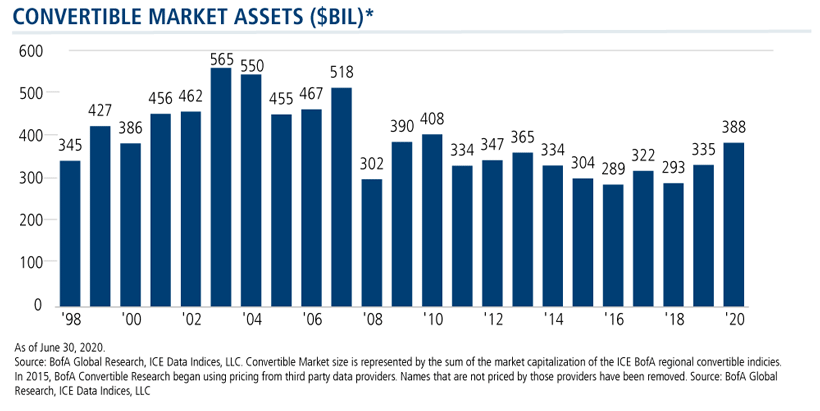
Overall, global convertible assets totaled $388 billion as of June 30—higher than at any point since 2010.
The Convertible Edge
For investors in these uncertain times, convertibles can provide unique advantages thanks to their hybrid features. An embedded long-dated option provides upside equity participation, while the convertible’s bond value provides potential risk mitigation during equity market drawdowns. However, it’s not simply convertible securities that make a strategy work: What matters is how convertibles are managed to achieve a particular investment objective.
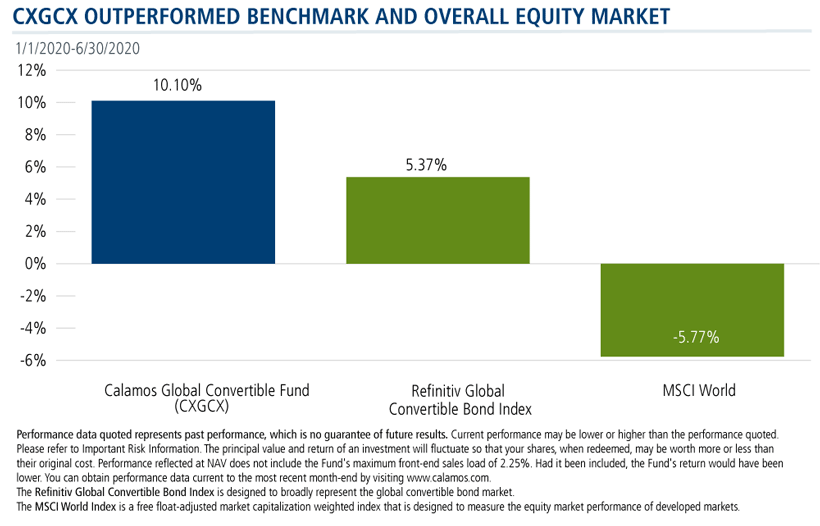
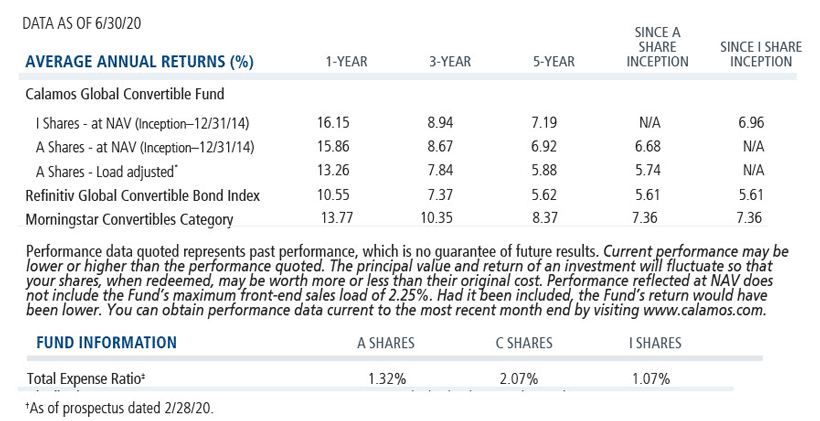
This year, for example, as anxiety about the coronavirus roiled risk assets, the Calamos Global Convertible Fund (CXGCX) benefited from active risk management and fundamental security selection to strongly outperform both the broad global convertible and equity markets.
The Dynamic Convertible Market
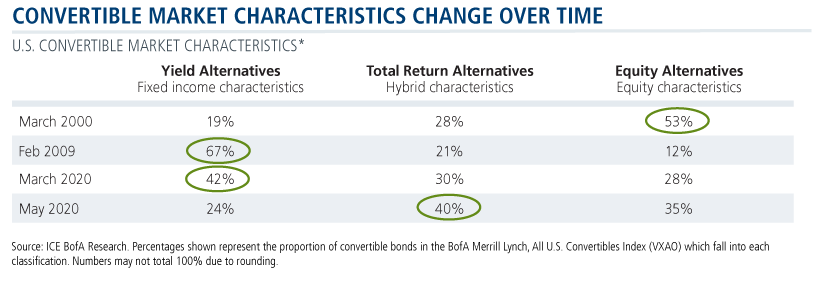
Active and ongoing management is paramount because these characteristics are not static. Below you can see how convertible characteristics change alongside market conditions, using the U.S. market as an example.
The convertible market demonstrated a much higher degree of equity sensitivity in March of 2000, against the backdrop of a peaking equity market and technology bubble. By February of 2009, the pendulum had swung to the other extreme. As the markets troughed in the liquidity crisis, more than two-thirds of convertible markets were trading as “credit-sensitive.” The characteristics of the convertible market can also shift quickly, due to market conditions, issuance, or both. In March of 2020, the market was dominated by issues with fixed income characteristics, but by the end of May, total return issues represented the lion’s share.
The Challenges Ahead
Although recent new issuance activity has produced issues with attractive structures, the CXGCX team emphasizes that not all convertibles represent compelling long-term opportunities. Selectivity will remain key during this volatile period, particularly as rising U.S. election uncertainty adds to coronavirus and economic concerns.
In this environment, the CXGCX team is emphasizing higher-quality technology names, as well as communication services and health care. Exposure includes positions that can benefit from a cyclical recovery, such as industrial names, as well as issues in the travel industry that came to market with unusually good terms. The fund is overweight the U.S. market, where the team has found many issues that offer the desired balanced risk/reward attributes. Conversely, CXGCX is underweight the European market.
Investment professionals, for more information on diversifying your clients’ portfolios with CXGCX, contact your Calamos Investment Consultant at 888-571-2567 or caminfo@calamos.com.
For a monthly update on the global convertible market, subscribe to the Calamos Global Convertible Market Snapshot.
Before investing, carefully consider the fund’s investment objectives, risks, charges and expenses. Please see the prospectus and summary prospectus containing this and other information which can be obtained by calling 1-866-363-9219. Read it carefully before investing.
The opinions referenced are as of the date of publication and are subject to change due to changes in the market or economic conditions and may not necessarily come to pass. Information contained herein is for informational purposes only and should not be considered investment advice. References to specific securities, asset classes and financial markets are for illustrative purposes only and are not intended to be, and should not be interpreted as, recommendations.
The principal risks of investing in the Calamos Global Convertible Fund include: equity securities risk consisting of market prices declining in general, growth stock risk consisting of potential increased volatility due to securities trading at higher multiples, foreign securities risk, emerging markets risk, currency risk, geographic concentration risk, American depository receipts, mid-size company risk, small company risk, portfolio turnover risk and portfolio selection risk. As a result of political or economic instability in foreign countries, there can be special risks associated with investing in foreign securities, including fluctuations in currency exchange rates, increased price volatility and difficulty obtaining information. In addition, emerging markets may present additional risk due to potential for greater economic and political instability in less developed countries.
Convertible Securities Risk: The value of a convertible security is influenced by changes in interest rates, with investment value declining as interest rates increase and increasing as interest rates decline. The credit standing of the issuer and other factors also, may have an effect on the convertible security’s investment value.
The Refinitiv Global Convertible Bond Index is designed to broadly represent the global convertible bond market.
The MSCI World Index is a free-float adjusted market capitalization-weighted index that is designed to measure the equity market performance of developed markets.
Morningstar Convertibles Category funds are designed to offer some of the capital appreciation potential of stock portfolios while also supplying some of the safety and yield of bond portfolios. To do so, they focus on convertible bonds and convertible preferred stocks. Convertible bonds allow investors to convert the bonds into shares of stock, usually at a preset price. These securities thus act a bit like stocks and a bit like bonds.
802064 0720
Archived material may contain dated performance, risk and other information. Current performance may be lower or higher than the performance quoted in the archived material. For the most recent month-end fund performance information visit www.calamos.com. Archived material may contain dated opinions and estimates based on our judgment and are subject to change without notice, as are statements of financial market trends, which are based on current market conditions at the time of publishing. We believed the information provided here was reliable, but do not warrant its accuracy or completeness. This material is not intended as an offer or solicitation for the purchase or sale of any financial instrument. The views and strategies described may not be suitable for all investors. This material has been prepared for informational purposes only, and is not intended to provide, and should not be relied on for, accounting, legal or tax advice. References to future returns are not promises or even estimates of actual returns a client portfolio may achieve. Any forecasts contained herein are for illustrative purposes only and are not to be relied upon as advice or interpreted as a recommendation.
Performance data quoted represents past performance, which is no guarantee of future results. Current performance may be lower or higher than the performance quoted. The principal value and return of an investment will fluctuate so that your shares, when redeemed, may be worth more or less than their original cost. Performance reflected at NAV does not include the Fund’s maximum front-end sales load. Had it been included, the Fund’s return would have been lower.
Archived on July 27, 2021