Significant Intra-Year Drawdowns Are Common
Both of these statements are true: Historically, the stock market’s general direction has been up. But during a given year, significant drawdowns have been common.
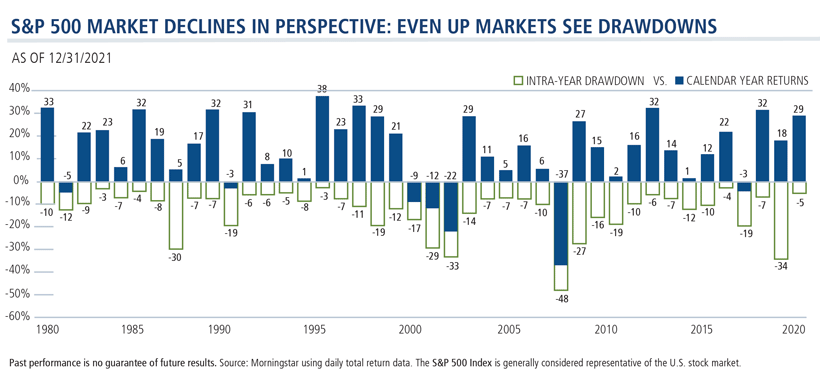
This chart shows the maximum intra-year equity market drawdowns since 1980. From this, we can see how frequently at least one double-digit decline occurs within any given calendar year. In 22 of the last 42 calendar years—more than half of the time—the S&P 500 saw a double-digit pullback within the year.
In every year, there was a market pullback and on average the market experienced a 13% decline. In the years when the S&P did experience a double-digit decline, 14 of those 22 times—or 64% of the time—the market ended the year with a positive return.

Disclosure
Opinions and estimates offered constitute our judgment and are subject to change without notice, as are statements of financial market trends, which are based on current market conditions. We believe the information provided here is reliable, but do not warrant its accuracy or completeness. This material is not intended as an offer or solicitation for the purchase or sale of any financial instrument. The views and strategies described may not be suitable for all investors. This material has been prepared for informational purposes only, and is not intended to provide, and should not be relied on for, accounting, legal or tax advice. References to future returns are not promises or even estimates of actual returns a client portfolio may achieve. Any forecasts contained herein are for illustrative purposes only and are not to be relied upon as advice or interpreted as a recommendation.
Past performance is no guarantee of future results.
The opinions referenced are as of the date of publication and are subject to change due to changes in the market or economic conditions and may not necessarily come to pass. Information contained herein is for informational purposes only and should not be considered investment advice.
A drawdown is the peak-to-trough decline during a specific record period of an investment, fund or commodity.
The S&P 500 Index is considered generally representative of the U.S. stock market. Indexes are unmanaged, do not entail fees or expenses and are not available for direct investment.
Before investing, carefully consider the fund’s investment objectives, risks, charges and expenses. Please see the prospectus and summary prospectus containing this and other information which can be obtained by calling 1-866-363-9219. Read it carefully before investing.
NOT FDIC INSURED | MAY LOSE VALUE | NO BANK GUARANTEE
802401 222

Scott Becker
Senior Vice President, Head of Portfolio Specialists Group
Cookies
This website uses cookies. By continuing to use this website, you consent to the use of cookies. Learn more about our cookie usage.

