 Investment Team Voices Home Page
Goooaal! Fundamental Momentum and Small Caps Win in 2Q
July 1, 2026
Brandon Nelson, CFA
Summary Points:
- Small-cap stocks extended their leadership over the quarter.
- We see significant and sustained upside for small caps from here, supported by fundamental earnings growth momentum, with attractive valuations increasing the appeal of the asset class.
- The Calamos Timpani funds both outperformed their peers and benchmarks over the quarter, demonstrating the value of our process and security selection, which rewards companies with sustainably fast and underestimated growth.
Despite continued high geopolitical tensions and the perception of a more hawkish US Federal Reserve, small caps, as measured by the Russell 2000 Index, rose each month of the quarter and led the overall stock market by a wide margin. This small-cap leadership is a surprise to many and a continuation of a trend that started about 14 months ago, following the longest stretch of small-cap relative underperformance on record (more than 8 years)!
Specifically, for the quarter, the Russell 2000 Index outperformed the Russell 1000 Index by 635 basis points. Since the small-cap rally started on April 9, 2025, the Russell 2000 Index has outperformed by 1,614 basis points. Micro caps, the smallest of the small, outperformed large caps by over 4,000 basis points!1
After several years of mega-cap dominance, the market is showing an appetite to broaden into other areas, including small caps. And why not? Small caps are relatively inexpensive and, importantly, are showing an accelerating earnings growth trajectory projected to last into 2027.2 This strong earnings profile should support continued small-cap outperformance.
Speaking of performance, the Calamos Timpani Small Cap Growth Fund (CTSIX) and Calamos Timpani SMID Growth Fund (CTIGX) had excellent quarters in absolute and relative terms. Each fund rose meaningfully and outperformed its respective benchmark and Morningstar category average by a wide margin during the quarter.
Calamos Timpani Funds: Outdistancing the Pack in 2Q
Q2 2026 returns, data as of 6/30/2026
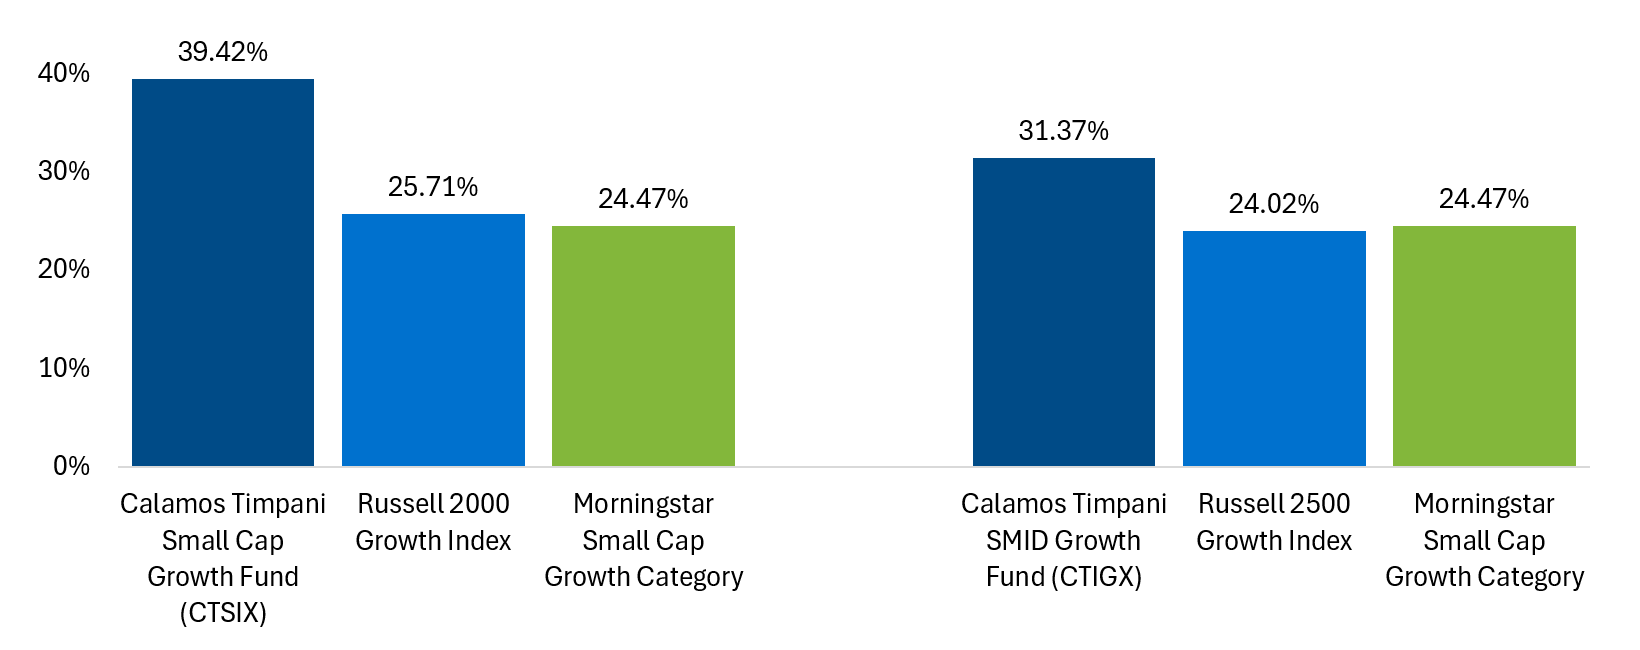
Source: Morningstar as of 6/30/26. Performance data quoted represents past performance, which is no guarantee of future results. Current performance may be lower or higher than the performance quoted. Please refer to Important Risk Information. The principal value and return of an investment will fluctuate so that your shares, when redeemed, may be worth more or less than their original cost. Performance reflected at NAV does not include the Funds’ maximum front-end sales load of 4.75%. Had it been included, the Funds’ return would have been lower. All performance shown assumes reinvestment of dividends and capital gains distributions. As of the prospectus dated 2/27/2026, CTSIX’s gross expense ratio is 1.09% and CTIGX’s gross expense ratio is 1.40%.
The strong fund performance was driven by a combination of our fundamental momentum investment style (i.e., sustainably fast and underestimated growth), along with our stock picking and positioning within that investment framework. For both funds, our ratio of big winners to big losers was skewed toward winners, driven by niche positioning within a variety of themes and company-specific situations.
In my commentaries over the years, I’ve described the Timpani investment process as “fundamental momentum,” but what does it look like in practice? The chart below illustrates the idea with an (unnamed) portfolio example. It shows the one-year trend of consensus analyst earnings-per-share estimates (EPS) for 2026, 2027, and 2028. Notice two things:
- The lines are far apart from one another, indicating fast growth (27% growth in 2027 versus 2026 and 20% growth in 2028 versus 2027); and
- The lines all rise over time, indicating positive revisions (implying the growth had been underestimated) for each year.
Fundamental momentum, as we define it, is sustainably fast and underestimated growth, both of which are on full display in this chart. This is the exact outcome we consistently seek.
Case Study in Fundamental Momentum: Fast Growth and Positive Revisions Year Over Year
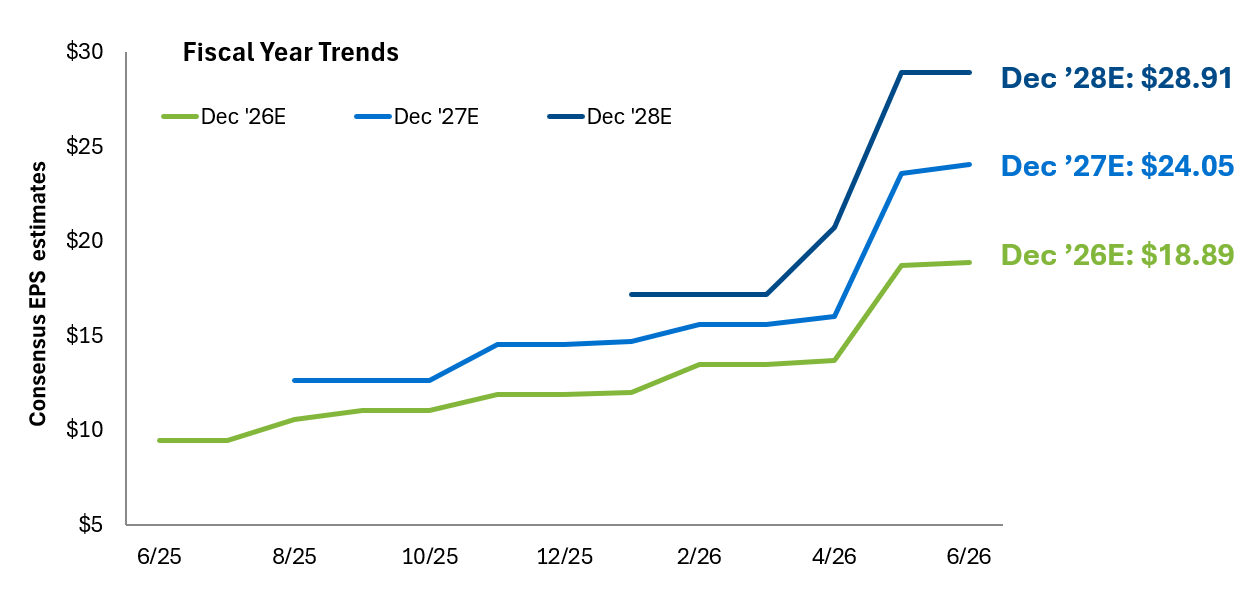
Past performance is no guarantee of future results. Source: Calamos Investments. For illustrative purposes only.
What’s not shown on the chart is the performance of this individual stock over the past year. We can see that the 2026 and 2027 EPS estimates each rose by about 100%. Logically, one would think the stock would also rise by about 100% over this same period. In fact, in this case, the stock rose by about 250%! The market was so impressed with the fundamental momentum profile that it decided the stock shouldn’t only rise in sync with the revision profile but instead deserved a higher valuation multiple on that earnings profile. This combination of fundamental momentum along with rising valuation multiples is normal and precisely why we utilize this strategy. We specifically look for setups with this profile and sell when we see early signs of fatigue in the fundamental momentum profile, which is often a leading indicator of negative analyst revisions and valuation multiple compression.
We’ve been good at consistently finding fundamental momentum, and since early 2024, the market has been embracing it and disproportionately rewarding many of the stocks in our funds. We’ve seen similar upcycles before and suspect this one could continue. That, along with our exposure to an improving small-cap asset class, keeps me upbeat about the future.
Total Returns as of 6/30/26
| 2Q 2026 | 1 Year | 3 Year | 5 Year | 10 Year | Fund Inception | |
|---|---|---|---|---|---|---|
| CTSIX | 39.42% | 64.84% | 34.65% | 10.24% | 18.32% | 14.69% (3/23/11) |
| Russell 2000 Growth Index | 25.71% | 38.74% | 18.44% | 5.57% | 11.97% | 10.90% |
| Morningstar Small Growth Category | 24.47% | 33.31% | 16.03% | 4.65% | 12.48% | 10.97% |
| CTIGX | 31.37% | 54.47% | 32.19% | 10.74% | — | 15.94% (7/31/19) |
| Russell 2500 Growth Index | 24.02% | 32.94% | 16.39% | 4.98% | — | 10.95% |
| Morningstar Small Growth Category | 24.47% | 33.31% | 16.03% | 4.65% | — | 10.75% |
Performance data quoted represents past performance, which is no guarantee of future results. Average annual total return measures net investment income and capital gains or losses from portfolio investments as an annualized average. All performance shown assumes reinvestment of dividends and capital gains distributions. Returns of more than one year are annualized.
For CTSIX, the chart shows the performance of the Predecessor Fund’s Institutional Class, which has been adopted by the Class I shares of the Fund for periods prior to the Reorganization. The information shows you how the Predecessor Fund’s performance has varied year by year and provides some indication of the risks of investing in the Fund. The average annual total return table compares the Predecessor Fund’s Institutional Class performance, adopted by the Fund’s Class I shares, and Class Y performance, adopted by the Fund’s Class A shares and adjusted to reflect the maximum sales load of 4.75%, to that of the Russell 2000 Growth Index. "Since Inception" return shown for the Russell 2000 Growth Index is the return since the inception of the Predecessor Fund’s Class Y shares. An index reflects no deduction for fees, expenses or taxes. To the extent that dividends and distributions have been paid by the Predecessor Fund, the performance information for the Predecessor Fund in the chart and table assumes reinvestment of dividends and distributions. If the Predecessor Fund’s investment adviser had not waived or reimbursed certain Predecessor Fund expenses during these periods, the Predecessor Fund’s returns would have been lower. As always, please note that the Fund’s past performance (before and after taxes) cannot predict how it will perform in the future.
Class I shares are offered primarily for direct investment by investors through certain tax-exempt retirement plans and by institutional clients, provided such plans or clients have assets of at least $1 million. For eligibility requirements and other available share classes, see the prospectus and other Fund documents at www.calamos.com.
Before investing, carefully consider the fund’s investment objectives, risks, charges and expenses. Please see the prospectus and summary prospectus containing this and other information which can be obtained by calling 1-866-363-9219. Read it carefully before investing.
Opinions, estimates, forecasts, and statements of financial market trends that are based on current market conditions constitute our judgment and are subject to change without notice. The views and strategies described may not be appropriate for all investors. References to specific securities, asset classes and financial markets are for illustrative purposes only and are not intended to be, and should not be interpreted as, recommendations.
Diversification and asset allocation do not guarantee a profit or protect against a loss.
1 Source for index returns: FTSE Russell. The Russell 2000 Index returned 21.49% for the three months ending June 30, 2026; the Russell 1000 Index returned 15.14%, for a difference of 635 basis points. For the period from April 9, 2025, through June 30, 2026, the Russell 1000 Index returned 41.26%; the Russell 2000 Index returned 57.40% (a difference of 1,614 basis points); and the Russell Microcap Index returned 81.90% (4,064 basis points more than the Russell 1000 Index). 2 Source for earnings growth projections: RBC.
Morningstar Small Growth Category funds focus on faster-growing companies whose shares are at the lower end of the market-capitalization range. Stocks in the bottom 10% of the US equity market’s capitalization are defined as small caps. Growth is defined based on fast growth (high growth rates for earnings, sales, book value, and cash flow) and high valuations (high price ratios and low dividend yields). The Russell 1000® Index measures the performance of the large-cap segment of the US equity universe. The Russell 2000® Index measures the performance of the small-cap segment of the US equity universe. The Russell 2000® Growth Index measures the performance of the small-cap growth segment of the US equity universe. It includes those Russell 2000® companies with higher price-to-value ratios and higher forecasted growth values. The Russell 2500® Growth Index measures the performance of the small to midcap growth segment of the US equity universe. It includes those Russell 2500 companies with higher growth earnings potential.
Unmanaged index returns, unlike fund returns, do not reflect fees, expenses or sales charges. Investors cannot invest directly in an index. The Russell Microcap® Index measures the performance of the microcap segment of the US equity market, and consists of the smallest 1,000 securities in the small-cap Russell 2000® Index, plus the next 1,000 smallest eligible securities by market cap.
Important Risk Information. An investment in the Fund(s) is subject to risks, and you could lose money on your investment in the Fund(s). There can be no assurance that the Fund(s) will achieve its investment objective. Your investment in the Fund(s) is not a deposit in a bank and is not insured or guaranteed by the Federal Deposit Insurance Corporation (FDIC) or any other government agency. The risks associated with an investment in the Fund(s) can increase during times of significant market volatility. The Fund(s) also has specific principal risks, which are described below. More detailed information regarding these risks can be found in the Fund’s prospectus.
The principal risks of investing in the Calamos Timpani Small Cap Growth Fund and Calamos Timpani SMID Growth Fund include equity securities risk consisting of market prices declining in general, growth stock risk consisting of the potential increased volatility due to securities trading at higher multiples, and portfolio selection risk. The Funds invest in small-capitalization companies, which are often more volatile and less liquid than investments in larger companies.
Foreign security risk: As a result of political or economic instability in foreign countries, there can be special risks associated with investing in foreign securities, including fluctuations in currency exchange rates, increased price volatility, and difficulty obtaining information. In addition, emerging markets may present additional risk due to the potential for greater economic and political instability in less developed countries.
NOT FDIC INSURED | NO BANK GUARANTEE | MAY LOSE VALUE
026054a 0726