We See Big Opportunities for Small Caps in 2023—Hear the Replay from Senior Portfolio Manager Brandon Nelson’s Webcast
February 28, 2023
On a February 23 webcast, Senior Portfolio Manager Brandon Nelson drew upon his 25 years of experience in the small-cap space to share why he believes the time is ripe for a rebound in small caps, and notably the Calamos Timpani Small Cap Growth Fund (CTSIX).
An Especially Upbeat Outlook for Small Cap Stocks
Nelson recalled, “I’ve seen a lot of cycles, and they’re all a little different.” He explained that the common thread with all cycles is that small caps tend to be more volatile with bigger swings up and down that larger caps. However, he noted that this recent period has been frustrating given how long small caps have had to take it on the chin. The Russell 2000 underperformed the Russell 1000 for the sixth year in a row, which Nelson found shocking because small caps tended to win when we look back over 100 years. The good news, according to Nelson, is that things look to be finally turning around for small caps.
Nelson’s key points:
- Small cap valuations have de-risked almost any way you look at them. They’re trading at a substantial discount to the S&P 500 and the Russell 1000. So we’ve got attractive valuations on the side of small caps.
- Disinflation is also on the side of small caps. When inflation comes down, it has historically provided a tailwind for small caps both in absolute and relative terms.
- The year 2022 was the third-worst year for the Russell 2000 Growth Index since its creation in the 1970s. But, for Nelson, the obvious question is: “What was the next year like?” On average, the Russell 2000 Growth Index was up 21% and the median stock in the index was up close to 25%.
- For the last 15 months, macro factors have dominated stock price movements. It started with Thanksgiving 2021 when the Fed became more hawkish. With the calming of macro conditions and less attention toward them, there should be an acceleration in the appreciation of small caps.
- We went through a period of multiple severe contractions in valuations, which settled down last summer even though the Fed continued to raise interest rates meaningfully.
When the Pendulum Swings To Small Caps with Fundamental Momentum, Nelson Believes CTSIX Will Be There in a Big Way
Nelson expressed a strong conviction that the pendulum is swinging in favor of CTSIX’s strategy and portfolio.
- In terms of picking stocks from a bottom-up standpoint, he sees tremendous opportunities as the team seeks out fundamental momentum based on robust and sustainable growth, and underestimated growth where companies have a knack for beating expectations and raising guidance.
- Nelson noted that the team has been consistently better at finding upside surprise relative to the upside in the Russell 2000 Growth Index benchmark. Approximately 76% of CTSIX stocks show an upside sales surprise (relative to consensus) compared with 59% for the benchmark.*
- In late 2022 and early 2023, many of the prior losers rallied sharply because of some benign macro data points. Inflation came in cooler than expected, triggering the buying of beaten-down stocks that had lousy fundamental profiles. Nelson noted, “We didn’t fully participate in that uptick because we own higher-quality, higher-growth names with better price momentum. We think January marked the capitulation of that mood.”
- He also noted that the best thing to do right now is to keep the portfolio positioned in names that have those fundamental momentum characteristics and wait for the pendulum to swing the team’s way. “When it does, we believe we’ll be there in a big way.”
To learn more about how CTSIX’s active strategy strives to capitalize on small-cap companies offering secular growth with visible revenue streams, listen to the full replay and Q&A with Brandon Nelson, CFA, here. He also shared examples of his security selection process in action.
*Source FactSet/Jeffries. Average upside surpise data from 3/31/2012 to 9/30/2022, the most recent quarter available.
Opinions, estimates, forecasts, and statements of financial market trends that are based on current market conditions constitute our judgment and are subject to change without notice. The views and strategies described may not be appropriate for all investors. References to specific securities, asset classes and financial markets are for illustrative purposes only and are not intended to be, and should not be interpreted as, recommendations.
Before investing, carefully consider the fund’s investment objectives, risks, charges and expenses. Please see the prospectus and summary prospectus containing this and other information which can be obtained by calling 1-866-363-9219. Read it carefully before investing.
The principal risks of investing in the Calamos Timpani Small Cap Growth Fund include: equity securities risk consisting of market prices declining in general, growth stock risk consisting of potential increased volatility due to securities trading at higher multiples, and portfolio selection risk. The Fund invests in small capitalization companies, which are often more volatile and less liquid than investments in larger companies. As a result of political or economic instability in foreign countries, there can be special risks associated with investing in foreign securities, including fluctuations in currency exchange rates, increased price volatility and difficulty obtaining information. In addition, emerging markets may present additional risk due to the potential for greater economic and political instability in less developed countries.
The S&P 500 Index is generally considered representative of the US stock market.
The Russell 2000 Index measures the performance of the 2,000 smallest companies in the Russell 3000 Index. The Russell 2000 Index is published and maintained by FTSE Russell.
The Russell 1000 Index measures the performance of the 1,000 largest companies in the Russell 3000 Index. The Russell 1000 Index is published and maintained by FTSE Russell.
Unmanaged index returns assume reinvestment of any and all distributions and do not reflect any fees, expenses or sales charges. Investors cannot invest directly in an index.
19103 0223
Archived material may contain dated performance, risk and other information. Current performance may be lower or higher than the performance quoted in the archived material. For the most recent month-end fund performance information visit www.calamos.com. Archived material may contain dated opinions and estimates based on our judgment and are subject to change without notice, as are statements of financial market trends, which are based on current market conditions at the time of publishing. We believed the information provided here was reliable, but do not warrant its accuracy or completeness. This material is not intended as an offer or solicitation for the purchase or sale of any financial instrument. The views and strategies described may not be suitable for all investors. This material has been prepared for informational purposes only, and is not intended to provide, and should not be relied on for, accounting, legal or tax advice. References to future returns are not promises or even estimates of actual returns a client portfolio may achieve. Any forecasts contained herein are for illustrative purposes only and are not to be relied upon as advice or interpreted as a recommendation.
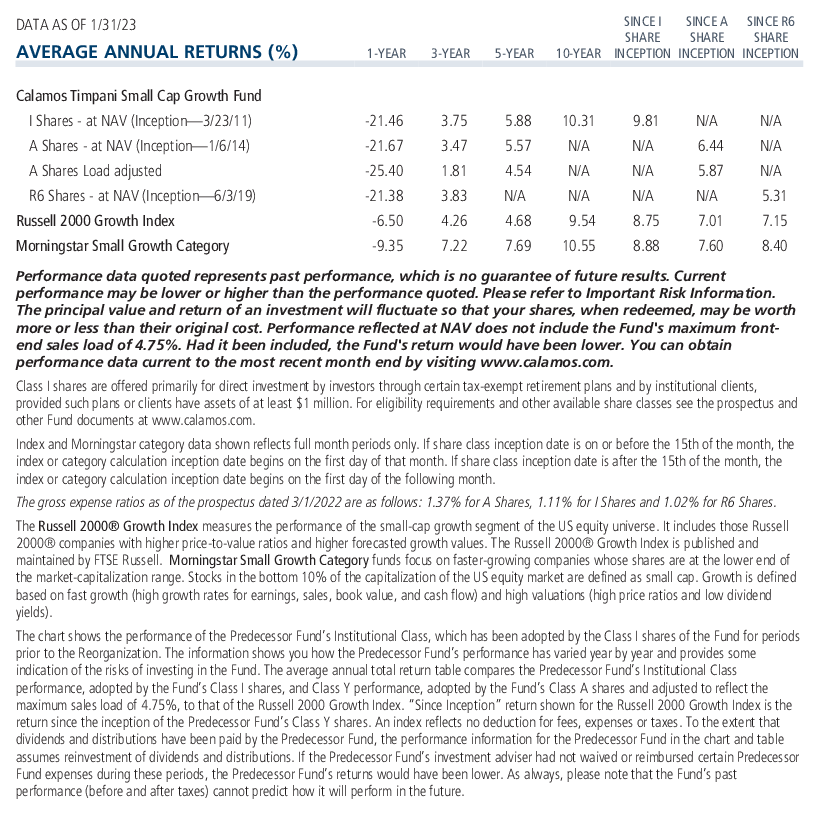
Performance data quoted represents past performance, which is no guarantee of future results. Current performance may be lower or higher than the performance quoted. The principal value and return of an investment will fluctuate so that your shares, when redeemed, may be worth more or less than their original cost. Performance reflected at NAV does not include the Fund’s maximum front-end sales load. Had it been included, the Fund’s return would have been lower.
Archived material may contain dated performance, risk and other information. Current performance may be lower or higher than the performance quoted in the archived material. For the most recent month-end fund performance information visit www.calamos.com. Archived material may contain dated opinions and estimates based on our judgment and are subject to change without notice, as are statements of financial market trends, which are based on current market conditions at the time of publishing. We believed the information provided here was reliable, but do not warrant its accuracy or completeness. This material is not intended as an offer or solicitation for the purchase or sale of any financial instrument. The views and strategies described may not be suitable for all investors. This material has been prepared for informational purposes only, and is not intended to provide, and should not be relied on for, accounting, legal or tax advice. References to future returns are not promises or even estimates of actual returns a client portfolio may achieve. Any forecasts contained herein are for illustrative purposes only and are not to be relied upon as advice or interpreted as a recommendation.
Performance data quoted represents past performance, which is no guarantee of future results. Current performance may be lower or higher than the performance quoted. The principal value and return of an investment will fluctuate so that your shares, when redeemed, may be worth more or less than their original cost. Performance reflected at NAV does not include the Fund’s maximum front-end sales load. Had it been included, the Fund’s return would have been lower.
Archived on February 28, 2024