 Investment Team Voices Home Page
What Factor Analysis Tells Us About Where Global Markets Are Headed
Kyle Ruge, CFA
July 12, 2021
A factor is any characteristic that is important in explaining the return and risk of a security. Each stock traditionally has a hierarchy of factors: sector/industry classification, geographic classification, and residual exposures. These are known as style factors. Growth and value are more well-known examples of style factors. Other primary style factors include beta, momentum, quality, lower volatility, and market capitalization. Stocks that load on these factors can be expected to act certain ways in given market environments and companies with a greater “load” in any factor can be expected to experience a more pronounced response.
Through the lens of these style factors, we’ve observed clear trends in global equity markets since the onset of the pandemic. Coming off 2020’s market lows, growth and momentum factors initially outperformed. Growth names generally align with secular growth themes that were accelerated as a result of the pandemic, while the growth factor traditionally performs better in environments where economic growth is more scarce. These names had been performing better heading into the pandemic and also make up a larger portion of U.S markets versus other regional markets, and thus had higher momentum loadings.
In November 2020, positive vaccine news catalyzed a clear shift in the market environment. Improving prospects for economic reopening and unprecedented global stimulus led to a more reflationary environment. The beta factor had performed well since the market lows given the ties that many companies had the overall market rebound. In November, these companies began outperforming to a greater degree; many of these names have ties to improving global growth prospects. Companies with heavier value factor loads began seeing better support, too. Reflationary prospects aid companies that are more capital intensive and have more operating leverage, as well as companies that benefit from rising interest rates (for example, banks).
As 2021 has progressed, the market has been much more rotational. Growth, value, beta, and momentum factors have all experienced volatility. This has occurred as the inflation debate has picked up, as illustrated by volatility in interest rates. Changes in reflationary prospects and concurrent changes to interest rates, will have differing impacts on these factors.
The chart below illustrates these volatile conditions and demonstrates how much the time frame matters in understanding what’s going on in the markets. The graphs on the left illustrate longer-term relative performance, while the graphs on the right focus on relative performance in 2021. Looking at 2021, we can see the violent rotations of the first quarter. We can also see the disparity narrow between U.S. growth equities and U.S. value equities, while the disparity widens between U.S. equities and international equities.
Volatility and Rotation Have Made for Turbulent Markets in 1H 2021
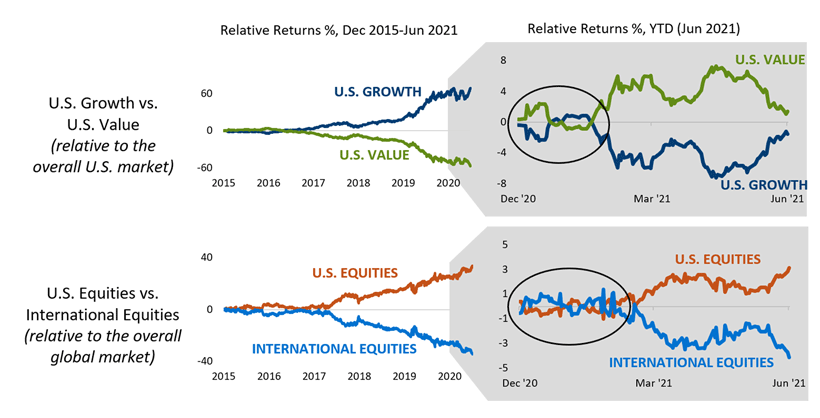
Past performance is no guarantee of future results. Source: Macrobond. Note: Relative returns represented as follows: U.S. Growth (MSCI U.S. Growth/MSCI U.S.), U.S. Value (MSCI U.S. Value/MSCI U.S.), U.S. Equities (MSCI U.S./MSCI ACWI) and International Equities (MSCI ACWI ex U.S./MSCI ACWI).
As we look forward, we can match our outlook for sustained global growth prospects and a continued reflationary environment against style factor expectations. In a more reflationary environment, companies with more pronounced value factor loads could see better support than they did in the past decade, with the caveat that companies with permanently disrupted business models would not see that same support. Companies that load on the beta factor can continue to perform well too, given ties to robust global growth as well as positive market moves. As a result of our fundamental and factor analysis, we have been increasing exposures to names that load more toward the beta and value factors.
With more robust global economic growth prospects, the environment for growth names on the whole may be less supportive versus historical periods. That said, we expect to maintain healthy exposure to this secular growth theme contingent, too. Companies that are aligned with secular themes and which have appropriate valuations when scaled against more sustainable earnings prospects can continue to perform well.
Conclusion
As active managers, we weigh many considerations in our portfolio construction process. Style factor analysis is just one of many tools in our toolbox, complementing fundamental research and identification of top-down themes. Style factor analysis can help us understand the past and prevailing market environments. When matched against our own market outlook, style factor analysis can deepen our insights about potential opportunity sets.
Indexes are unmanaged, do not include fees or expenses and are not available for direct investment. The MSCI U.S. Index is designed to measure the performance of the large and mid-cap segments of the U.S. market. With 627 constituents, the index covers approximately 85% of the free float-adjusted market capitalization in the US. The MSCI U.S. Growth Index captures large and mid-cap securities exhibiting overall growth style characteristics in the U.S. The growth investment style characteristics for index construction are defined using five variables: long-term forward EPS growth rate, short-term forward EPS growth rate, current internal growth rate and long-term historical EPS growth trend and long-term historical sales per share growth trend. The MSCI U.S. Value Index captures large and mid-cap U.S. securities exhibiting overall value style characteristics. The value investment style characteristics for index construction are defined using three variables: book value to price, 12-month forward earnings to price and dividend yield. The MSCI ACWI Index is a measure of the global stock market performance, including developed and emerging markets. The MSCI ACWI ex U.S. is a measure of the global stock market performance, including developed markets and emerging markets but excluding the U.S. market.
18901 0721 O C