 Investment Team Voices Home Page
A Very Different Decade Ahead
June 22, 2023
Key Points:
- Consistent with our January Outlook, we see further mild upside for US equities. However, this year’s constructive price action should not be characterized as a new bull market.
- Financial assets have enjoyed the window of disinflation that commenced last autumn. But there is a discontinuity on the horizon: we are not returning to the low-and-stable inflation era.
- Many investors rely upon momentum-based strategies. These proved effective in the era of “free money,” but will be less so with waning liquidity and the maturity of the earnings cycle.
- Success will increasingly depend on more tactical and cyclical approaches to equity allocation, and to style and security selection. This is an advantageous environment for CPLIX.
Investors have cheered the news that the S&P 500 Index has rallied 20% from the October 2022 lows, thus earning1 that hallowed title of “bull market.” Investors dwell upon this language as a comfort blanket for their allocations, yet this label of “bull” or “cyclical bull in a bear market” presumes a flawed paradigm. It encourages the mistaken belief that financial prices will trend in a persistent direction, leading investors to buy near the highs and sell near the lows.
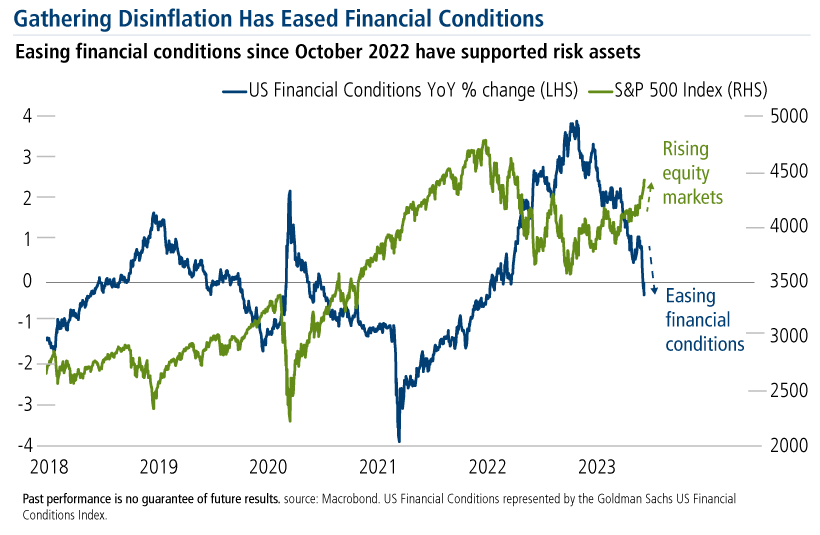
Since last autumn, our view has been that US equities would enjoy some healthy respite for two reasons. First, recession risk is negligible in 2023, and thus the much-feared collapse of US corporate profitability is a mirage. And second, in the absence of economic calamity, the key narrative would become the gathering momentum of disinflation. As the data emerged to support this, easing financial conditions have provided upside relief for equities and bonds alike.
This story has legs into summer because the consumer price data will continue to look benign. The next acts in the inflation drama will feature the improvement in the core services components and the lagging government rent data. The average rent figures incorporated into the CPI and GDP-deflator are fated to continue easing, allowing the rate of inflation2 to approach 3% in the coming months—the low of this cycle.
This more tolerable pace has convinced markets that the Federal Reserve is ending its tightening policy despite its hawkish demeanor. FOMC policy pronouncements are dismissed as trailing indicators for financial prices because Chairman Powell and his colleagues have been well “behind the curve.” In effect, investors have been front-running the June rate pause since early spring on the inference that a “slow-motion pause” is a pause indeed.
But Not a New Bull Market
More benign inflation and thus a less feared Fed in combination with no recession have provided a window of relief for markets. Yet, this move higher should be characterized as part of a broad multi-year trading range for equities rather than a sustained bull market.
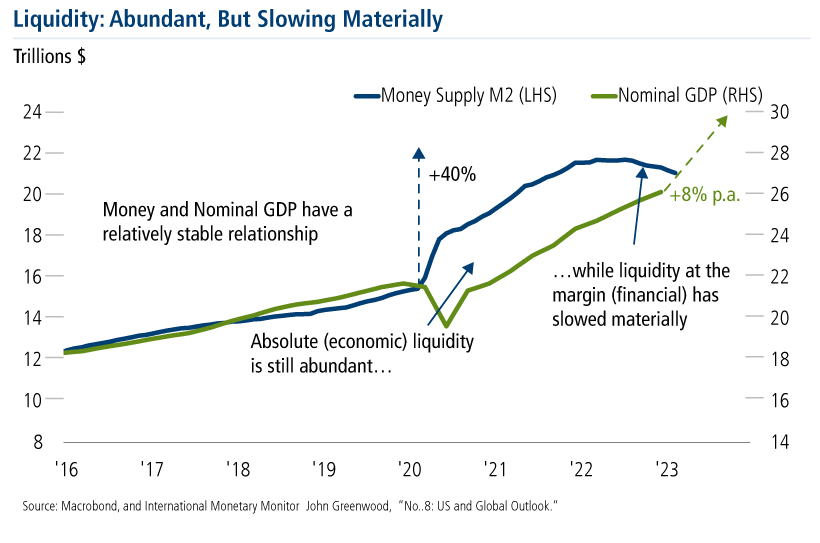
One reason is the changing nature of the liquidity setting. Absolute liquidity in the system is still extraordinary and evident in the health of private sector balance sheets. While absolute liquidity underpins the resilience of the economy, financial prices are more sensitive to the rate of change of aggregate liquidity, which has slowed materially. Liquidity is being drawn into the real economy but at the expense of the financial economy.
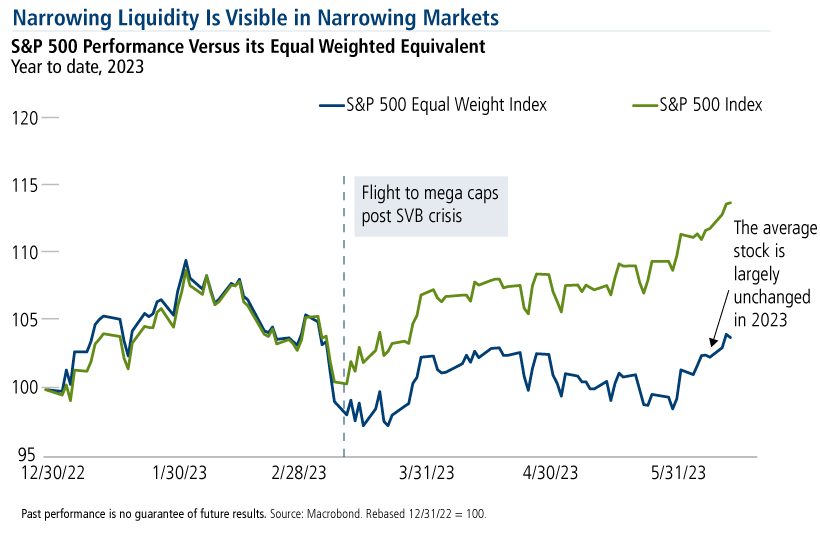
This inert pool of excess liquidity explains the narrowing breadth of equity market gains. The average stock price remains in a broad sideways pattern, with the vast bulk of S&P 500 gains in 2023 driven by a concentration of mega-cap stocks.3 This dichotomy is evident when one compares the 2023 performance of the capitalization-weighted S&P 500 Index versus its equal-weighted equivalent.
The second constraint on a “new bull” is the maturity of the earnings cycle. The oft-quoted fear that corporate profits will decline due to cost inflation is misplaced because that same inflation is driving healthy top-line growth. The real issue for margins is the maturity of the business cycle—capacity utilization across the broader economy is near 100%. Earnings are not about to collapse, but the upside is equally tepid.
2023: Interregnum
The leading narrative for the equity world is “disinflation momentum.” One year ago, US inflation hovered near 9%. Today it is 5% and heading lower still—the fastest drop on record. Sentiment around inflation and interest rates has been paramount, and thus higher valuations rather than earnings growth have supported equities. The obvious debate has to do with how much longer this can continue.
Many regard today’s inversion of the US Treasury yield curve4 as a sign of an imminent recession. After all, an inverted yield curve has historically marked an economic downturn within 18 months. Our interpretation is more nuanced. Yield inversion may primarily reflect the market’s deep belief that we are returning to the low-and-stable inflation era that existed prior to the pandemic5. This insight contains the key risk for equities.
Investors easily embrace this prospect for price stability because they believe (with good reason) that the Western world has not truly exited the deflationary era. Led by Powell, central bankers have a plan to rediscover the old world of 2% inflation and investors trust that plan. As outlined above, most of the inflation data into summer should reinforce this conviction.
But there is a discontinuity on the horizon: the reductions in the pandemic inflation surge may involve an easy part and a hard part. Inflation has indisputably turned lower, but we await what might be described as, or what many hope will again be “low and stable.” Put simply, there is a wide dispersion of reasonable interpretations for what comes next.
A Very Different Decade
The reformulation of Western policy regimes through the pandemic creates uncertainty about the future of price stability. Prior to this, the ascendancy of globalization generated an elasticity of supply6 that resulted in a stable relationship between economic growth and inflation. This enabled central bankers to practice monetary reflation in a methodical fashion. Today, investors maintain inordinate confidence that central bankers can again deliver on that paradigm.
The exceptional policy response of the 2020s was the coup de grace to the driving orthodoxy of the prior 30 years: neoliberalism economics7 and its poster child, globalization. It is clear that globalization is “in retreat” almost everywhere. Its demographics are exhausted, as are its policy underpinnings of neoliberalism. The latter has been discredited by its association with plutocracy, the rise of China and the promotion of capital subsidization.
In its place is a new ethos that we describe as Interventionist (aka Big) Government because the former ideology that “markets know best” has atrophied. Examples include how ESG has become a politicized agenda, channeling capital in directions mandated by the State. The US-China rivalry is another rationale to embrace new systems of social and economic integration. The “cost of living” crisis of 2022 was the latest justification for intervention, as if we must be compensated for economic distress whatever its origins.
The pandemic pressures culminated in the collapse of fiscal and monetary discipline that drove the asset price bonanza in its early years. Its footprint remains visible. Fiscal stimulus is still reverberating across much of the US economy, supporting our thesis of economic resilience. The latest Congressional debt deal has federal spending advancing 7% in 2024—hardly the stuff of economic contraction. Everyone has learned that unlimited capital can be created when expedient, even if the circumstances are not especially dire.
History suggests there is a price to be paid for the removal of financial discipline. One might naturally assume that a long period of low returns for equities is one inevitable consequence. Many of our clients would agree with this forecast, premised upon the view that the post-2008 era of “free money” is not returning any time soon. Much of this is consistent with a broad multi-year trading range for equities, which remains our central forecast. However, this may not capture the full flavor of what lies ahead.
To be clear, our interpretation is not one of persistently high inflation a la the 1970s. The aging of the Western labor force is inconsistent with a broad demand shock. Instead, this is a forecast of quasi-price instability, in which rates of inflation and thus measures of nominal economic activity are far more variable than in the past quarter century. This demise of “low and stable” inflation may be the principal discontinuity for investors.
Conclusion:
- US recession risk is negligible in 2023. The case for a hard or soft landing in 2024 awaits the nature of the inflation data in H2.
- Central bankers will struggle with this new setting of quasi-price instability, preventing any return to the “free money” era. This will alter the character of equity returns.
- Equity benchmarks are unlikely to trend directionally in coming years, undermining the effectiveness of momentum-based strategies. Clients should consider a more tactical approach.
- Enjoy the Interregnum and stay nimble. Amidst price instability and cost-push pressures for labor, 2024 is ripe for a comet tail of policy errors by central bankers.
1Generally, a bull or bear market is defined as a rise or decline respectively of 20% or more in a broad market index.
2US shelter inflation is the CPI basket’s largest component. Leading indicators of shelter such as the Zillow observed rent index which includes new leases point to an imminent fall in rental inflation. US CPI ex shelter was 2.2% yoy in May, which implies the broader CPI would approach this level if the shelter component (+8% yoy in May) was too slow.
3Into early June, just 10 stocks have driven more than three-quarters of the S&P500 gains in 2023: AAPL, MSFT, NVDA, GOOG, AMZN, META, TSLA, AVGO, AMD and CRM. This is the highest concentration of return on record for any six-month timeframe. Equally notable is that these gains have been driven entirely by multiple expansion, not earnings growth.
4The U.S. Treasury yield curve compares the yields of short-term Treasury bills to those of long-term Treasury notes.
5Yield curve inversion may signal Fed policy (short) rates that are too high for the natural growth rate of the economy. Alternatively, Fed policy and short rates may be appropriate, but the market forces that dominate longer-term rates may be too sanguine about inflation.
6An estimated 800 million of lowly paid workers were thrown into the global labor pool beginning in the early 1990s, predominantly from China and Eastern Europe.
7Neoliberalism is a political approach that favors free-market capitalism, deregulation and a reduction in government spending.
Before investing, carefully consider the fund’s investment objectives, risks, charges and expenses. Please see the prospectus and summary prospectus containing this and other information which can be obtained by calling 1-866-363-9219. Read it carefully before investing.
HOLDINGS INFORMATION: CALAMOS PHINEUS LONG/SHORT FUND
LARGEST POSITIONS (CASH BASIS), LONG AND SHORT AS OF 5/31/23 (% OF NET ASSETS)
| Company | Position | % |
|---|---|---|
| Amazon.com Inc. | Long | 6.4 |
| Microsoft Corp. | Long | 5.3 |
| Alphabet Inc. - Class A | Long | 5.1 |
| CSX Corp. | Long | 4.2 |
| Humana Inc. | Long | 4.1 |
| SPDR S&P 500 ETF Trust | Short | -22.9 |
| Apple Inc. | Short | -2.4 |
| Lam Research Corp. | Short | -2.0 |
| Salesforce Inc. | Short | -1.7 |
| Costco Wholesale Corp. | Short | -1.6 |
Holdings and weightings are subject to change daily. Holdings are provided for informational purposes only and should not be deemed as a recommendation to buy or sell the securities mentioned.
Opinions, estimates, forecasts, and statements of financial market trends that are based on current market conditions constitute our judgment and are subject to change without notice. The views and strategies described may not be appropriate for all investors. References to specific securities, asset classes and financial markets are for illustrative purposes only and are not intended to be, and should not be interpreted as, recommendations.
Important Risk Information. An investment in the Fund is subject to risks, and you could lose money on your investment in the Fund. There can be no assurance that the Fund will achieve its investment objective. Your investment in the Fund is not a deposit in a bank and is not insured or guaranteed by the Federal Deposit Insurance Corporation (FDIC) or any other government agency. The risks associated with an investment in the Fund can increase during times of significant market volatility. The Fund also has specific principal risks, which are described below. More detailed information regarding these risks can be found in the Fund’s prospectus.
The principal risks of investing in the Calamos Phineus Long/Short Fund include: equity securities risk consisting of market prices declining in general, short sale risk consisting of the potential for unlimited losses, leverage risk, and foreign securities risk. As a result of political or economic instability in foreign countries, there can be special risks associated with investing in foreign securities, including fluctuations in currency exchange rates, increased price volatility and difficulty obtaining information. In addition, emerging markets may present additional risk due to the potential for greater economic and political instability in less-developed countries.
Alternative investments may not be suitable for all investors. The Fund takes long positions in companies that are expected to outperform the equity markets, while taking short positions in companies that are expected to underperform the equity markets and for hedging purposes. The Fund may lose money should the securities the Fund is long decline in value or if the securities the Fund has shorted increase in value, but the ultimate goal is to realize returns in both rising and falling equity markets while providing a degree of insulation from increased market volatility.
This material is distributed for informational purposes only. The information contained herein is based on internal research derived from various sources and does not purport to be statements of all material facts relating to the information mentioned and, while not guaranteed as to the accuracy or completeness, has been obtained from sources we believe to be reliable.
The portfolio is actively managed. Holdings, sector weightings, net exposures and geographic weightings subject to change daily.
19106 0623