

 Investment Team Voices Home Page
The Cycle Raises the Bar
October 1, 2026
John Hillenbrand, CPA
Summary Points:
- We have moved to a positive but more cautious risk posture; the mid-cycle expansion is running ahead of our July base case, and the Fed has begun raising rates to catch up with it.
- As inflation stalled above target and the Fed began raising rates, we reduced risk by adding index puts, paring equity-like convertibles, and shifting toward less cyclical sectors and factors, while keeping our equity overweight.
- Earnings broadened this year as we expected, but consensus expectations see 2027 growth re-concentrating in technology; higher rates raise the bar, and new positions must show growth in both revenue and margins.
- AI remains the earnings engine; we have shifted some of our exposure toward the platforms and software that monetize it and away from the capital-spending supply chain.
- We would de-risk further if rates rose on risk premia rather than a higher neutral rate, if AI financing tightened, if hyperscaler spending guidance were cut, or if labor market data broke decisively.
Calamos Growth and Income Fund (CGIIX)
Morningstar Overall RatingTM Among 116 Moderately Aggressive Allocation funds. The Fund's risk-adjusted returns based on load-waived Class I Shares had 4 stars for 3 years, 4 stars for 5 years and 5 stars for 10 years out of 116, 111 and 97 Moderately Aggressive Allocation Funds, respectively, for the period ended 8/31/2026.
The US economy remains in a mid-cycle expansion, running ahead of the base case we set out in July. Tracking estimates put third-quarter growth near 2.75%, earnings growth has broadened across the market, and investment tied to artificial intelligence remains the largest single source of real growth. The forces against the expansion have also grown: inflation has stalled above target; the Strait of Hormuz remains contested with Brent crude near $100, and Houthi forces now threaten the Red Sea route around it; and policy moves on Iran, Russia, and tariffs have weighed on growth. The Federal Reserve raised rates by 25 basis points in September to a range of 3.75% to 4.00%, its first increase since 2023, and its projections point to one more this year. The question this quarter is why rates are rising. We believe it is because the cycle is strong enough to lift the neutral rate, not because policy is tightening into a slowdown. We have moved to a positive but more cautious risk posture.
Last quarter, we asked whether that shock was large enough to end the expansion or whether it was a disruption the cycle could absorb. It was the latter. The question now is different. It is not whether the cycle survives a shock but whether its leadership broadens beyond a narrow set of AI winners or remains concentrated. We expect broadening. Growth is holding near 2%, headline inflation is elevated but moderating, the labor market is softening but not breaking, and the earnings growth that has carried the market is beginning to widen.
Our July outlook expected leadership to broaden beyond a narrow set of AI winners, inflation to moderate steadily, and the rate path to remain too uncertain to position around. Earnings broadened; prices did not. Inflation stalled above target instead, and the rate uncertainty resolved toward hikes.
Calamos Growth and Income Fund (CGIIX) returned 0.46% for the quarter, behind the S&P 500 Index’s 2.30% and ahead of the Bloomberg US Aggregate Bond Index’s −3.51%. Our overweight in equity exposure relative to fixed income added value; where we held it did not. The quarter’s momentum leaders in the AI capital-spending supply chain and electrification reversed as rates rose and concerns over data centers and AI safety weighed on sentiment. Our overweight there was the largest detractor, along with the cost of index protection, while positions in AI platforms, software, and refiners contributed. Convertibles cushioned part of the decline, except where they had become equity-like, and we have shifted out of those positions into new issues with more balanced attributes.
Growth Drivers Remain Intact
The positive forces supporting economic expansion are still intact. Fiscal support continues to flow, the deregulatory impulse is additive to growth, and hyperscaler capital spending guidance has continued to ratchet higher. We expect AI spending to prove largely resilient to higher rates because demand remains strong and the largest spenders are competing for market share. Frontier AI models improved substantially again this quarter, and as pricing moves from flat fees to usage-based billing, customers are paying for more usage, which we interpret as evidence that the models return real value to users. Many of the current model capabilities are still underused, and companies are only now building the software harnesses that connect the models to their own data and workflows, which is where capability turns into productivity.
Our highest-conviction view is that adoption is in its early stages. We interpret the selloff in the AI capital-spending supply chain as driven more by sentiment than fundamentals. Concerns over data centers and AI safety intensified even as use cases broadened, and in September, semiconductor shares rebounded while technology earnings estimates kept rising. Developers are addressing local concerns over power costs and community impact, including pledges to pay for their own electricity, and we expect those concerns to ease after the November elections. AI safety is a legitimate concern, but it’s one we believe the industry can address.
Earnings breadth is less secure than it looks. Consensus estimates place most of next year’s index earnings growth in technology, and the slowdown elsewhere largely reflects margins and the lapping of one-time investment gains, although revenue growth also slows in most sectors. That is where the bar rises. Outside AI, we now require growth in both revenue and margins, with real growth tailwinds and improving returns on capital to back it.
Figure 1. Earnings growth is expected to narrow in 2027, led by technology and health care
S&P 500 earnings and revenue growth by sector, calendar 2026 and 2027 consensus estimates (%)
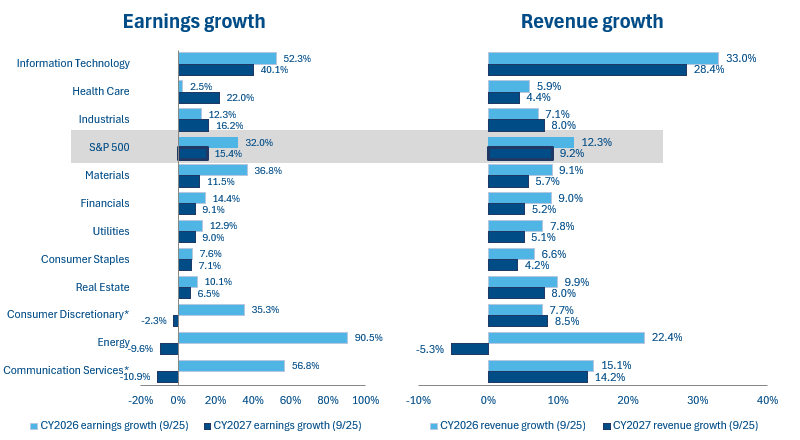
*2026 figures for communication services and consumer discretionary include large non-operating gains on equity investments reported by the sectors’ largest companies in the second quarter; their 2027 declines largely reflect lapping those gains rather than weaker operating results.
Source: FactSet Earnings Insight, September 25, 2026. Bottom-up consensus estimates, sorted by 2027 earnings growth; estimates are forward-looking and subject to change. Past performance is no guarantee of future results.
Rates and the Inflation Question
The forces weighing against the expansion are real but, in our assessment, manageable. Since February, the 10-year Treasury yield has risen more than a full point to its highest level since 2002, almost entirely in real yields, while inflation expectations have held steady. We interpret this as a higher neutral rate, with strong growth and the capital demands of the AI buildout, which Fed Chair Warsh has cited, lifting real rates globally alongside fiscal deficits. As the neutral rate rises, a given policy rate becomes less restrictive. Higher rates may slow growth at the margin, but we do not expect them to substantially increase recession risk at this time. They do raise the discount rate on the longest-duration equity and the hurdle that every investment must clear. The most recent interest rate increases coincided with a global bond selloff driven by increased growth expectations. We would be concerned if rates rose higher on worries about government borrowing rather than on economic strength.
Figure 2. The rise in yields has come from real rates, not inflation expectations
10-year Treasury yield split into real yield and breakeven inflation (%)
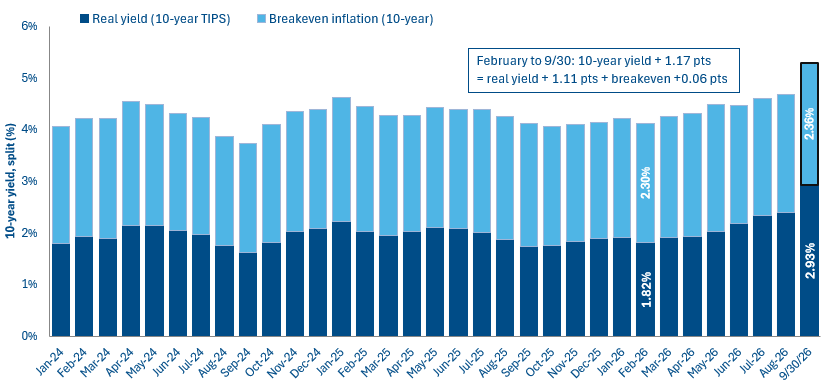
Source: Board of Governors of the Federal Reserve System and Federal Reserve Bank of St. Louis, retrieved from FRED: FII10 and T10YIEM (monthly averages, January 2024 to August 2026) and DFII10 and T10YIE (daily values, 9/30/2026, outlined bar). The real yield is the 10-year Treasury inflation-indexed (TIPS) yield; breakeven inflation is the 10-year nominal yield minus the TIPS yield. Past performance is no guarantee of future results.
Positioning and Outlook
Our positioning reflects this framework. In July, we said we would de-risk through the convertible and options sleeves if inflation re-accelerated and the Fed turned decisively toward hikes. Inflation stalled rather than re-accelerated, but the Fed raised rates nonetheless. Because higher policy rates weigh most on our longest-duration holdings, we decided to reduce risk. We added index puts to mitigate exposure to equity drawdowns, sold convertibles that had become equity-like, redeployed assets into balanced new issues with more convexity, and shifted sector and factor exposure toward less cyclical and less risky areas. We reduced exposure to industrials and the capital-spending supply chain, where our caution concerns valuation rather than demand, and added to health care, where new product introductions and improving margins offer real growth tailwinds and improving returns on capital into 2027. Consensus expects health care earnings to grow about 22% next year, second only to technology.
We also added short-term Treasuries and lower-beta income exposure, and we hold energy close to benchmark weight on the view that supply and demand adjust over the intermediate term. Under US naval escort, crude flows through the Strait have recovered to prewar levels, and Saudi-backed Yemeni forces are pushing back against the Houthis, though record tanker rates and constrained refinery output are keeping fuel prices high. We did not move to a defensive posture and kept our equity overweight, consistent with our view that the hike reflects a higher neutral rate rather than restriction.
Base case (highest probability). The expansion continues above trend in the near term and moderates toward the low 2% range into 2027. The Fed follows a higher neutral rate with one or two further increases rather than a sustained cycle. Core inflation holds near 3%, and oil eases as supply and demand adjust, leaving returns dependent on earnings rather than multiples.
Upside case. The Strait reopens under a negotiated settlement, disinflation accelerates, and AI monetization outpaces spending, lowering the hurdle for returns on capital.
Downside case. Yields rise on risk premia rather than a higher neutral rate, or faster than equities can absorb, or tighter AI financing stalls the spending cycle even with demand intact.
Third-quarter earnings and hyperscaler guidance, inflation and the Fed, the Strait of Hormuz, and the US November elections will determine which path materializes. We would de-risk further if rates rose on risk premia, AI spending or financing weakened, or labor data broke, and would add on cleaner inflation and broader earnings growth. The cycle is now strong enough to raise the bar, and we are positioned to own the businesses that clear it.
Total Returns as of 9/30/26
| 3Q26 | YTD | 1 Year | 3 Year | 5 Year | 10 Year | |
|---|---|---|---|---|---|---|
| Calamos Growth and Income Fund (CGIIX) | 0.46% | 11.84% | 14.27% | 20.37% | 11.30% | 13.03% |
| S&P 500 Index | 2.30% | 12.75% | 15.74% | 22.88% | 13.79% | 15.33% |
| ICE BofA All US Convert Ex Mandatory Index | -7.03% | 14.43% | 16.17% | 16.97% | 6.19% | 12.31% |
Source: Morningstar. Performance data quoted represents past performance, which is no guarantee of future results. Current performance may be lower or higher than the performance quoted. Please refer to Important Risk Information. The principal value and return of an investment will fluctuate so that your shares, when redeemed, may be worth more or less than their original cost. The funds’ gross expense ratio as of the prospectus dated 2/27/2026 is 0.80% for Class I Shares.
Average annual returns measure net investment income and capital gain or loss from portfolio investments as an annualized average, assuming reinvestment of income and capital gain distributions. In calculating net investment income, all applicable fees and expenses are deducted from the returns. Calendar year returns measure net investment income and capital gain or loss from portfolio investments for each period specified. The fund also offers Class C shares, the performance of which may vary. Class I shares are offered primarily for direct investment by investors through certain tax-exempt retirement plans and by institutional clients, provided such plans or clients have assets of at least $1 million. For eligibility requirements and other available share classes see the prospectus and other Fund documents at www.calamos.com.
Before investing, carefully consider the fund’s investment objectives, risks, charges and expenses. Please see the prospectus and summary prospectus containing this and other information which can be obtained by calling 1-866-363-9219. Read it carefully before investing.
Diversification and asset allocation do not guarantee a profit or protect against a loss.
Morningstar Ratings™ are based on risk-adjusted returns and are through the month end and for the share class listed and will differ for other share classes. Morningstar ratings are based on a risk-adjusted return measure that accounts for variation in a fund’s monthly historical performance (reflecting sales charges), placing more emphasis on downward variations and rewarding consistent performance. Within each asset class, the top 10%, the next 22.5%, 35%, 22.5%, and the bottom 10% receive 5, 4, 3, 2 or 1 star, respectively. Each fund is rated exclusively against US domiciled funds. The information contained herein is proprietary to Morningstar and/or its content providers; may not be copied or distributed; and is not warranted to be accurate, complete or timely. Neither Morningstar nor its content providers are responsible for any damages or losses arising from any use of this information. Source: ©2026 Morningstar, Inc.
Morningstar Moderately Aggressive Allocation funds in allocation categories seek to provide both income and capital appreciation by primarily investing in multiple asset classes, including stocks, bonds, and cash. These moderately aggressive strategies prioritize capital appreciation over preservation. They typically expect volatility similar to a strategic equity exposure between 70% and 85%.
Opinions, estimates, forecasts, and statements of financial market trends that are based on current market conditions constitute our judgment and are subject to change without notice. The views and strategies described may not be appropriate for all investors. References to specific securities, asset classes and financial markets are for illustrative purposes only and are not intended to be, and should not be interpreted as, recommendations.
The S&P 500 Index is generally considered representative of the US stock market. The ICE BofA All US Convertibles ex Mandatory Index (V0A0) represents the US convertible market excluding mandatory convertibles. Source ICE Data Indices, LLC, used with permission. ICE permits use of the ICE BofA indices and related data on an ‘as is’ basis, makes no warranties regarding same, does not guarantee the suitability, quality, accuracy, timeliness, and/or completeness of the ICE BofA Indices or data included in, related to, or derived therefrom, assumes no liability in connection with the use of the foregoing and does not sponsor, endorse or recommend Calamos Advisors LLC or any of its products or services. Indexes are unmanaged, do not include fees or expenses and are not available for direct investment.
Important Risk Information. An investment in the Fund(s) is subject to risks, and you could lose money on your investment in the Fund(s). There can be no assurance that the Fund(s) will achieve its investment objective. Your investment in the Fund(s) is not a deposit in a bank and is not insured or guaranteed by the Federal Deposit Insurance Corporation (FDIC) or any other government agency. The risks associated with an investment in the Fund(s) can increase during times of significant market volatility. The Fund(s) also has specific principal risks, which are described below. More detailed information regarding these risks can be found in the Fund’s prospectus.
The principal risks of investing in the Calamos Growth and Income Fund include the potential for convertible securities to decline in value during periods of rising interest rates and the possibility of the borrower missing payments; synthetic convertible instruments risks include fluctuations inconsistent with a convertible security and components expiring worthless. Others include equity securities risk, growth stock risk, small and midsize company risk, interest rate risk, credit risk, liquidity risk, high yield risk, forward foreign currency contract risk, and portfolio selection risk.
026077h 1026