

 Investment Team Voices Home Page
Navigating the Air Pockets in a Long-Term Uptrend
October 1, 2026
Brandon Nelson, CFA
Summary Points:
- Many investors believe small caps get clobbered by Fed hikes, but historically, small caps have outperformed after the initial shock wears off.
- It was a tricky quarter to navigate, but we reacted quickly. After a difficult July, when AI infrastructure names took a hit, we gained back ground versus benchmarks in August and September, with the portfolios benefiting from both our buy and sell decisions.
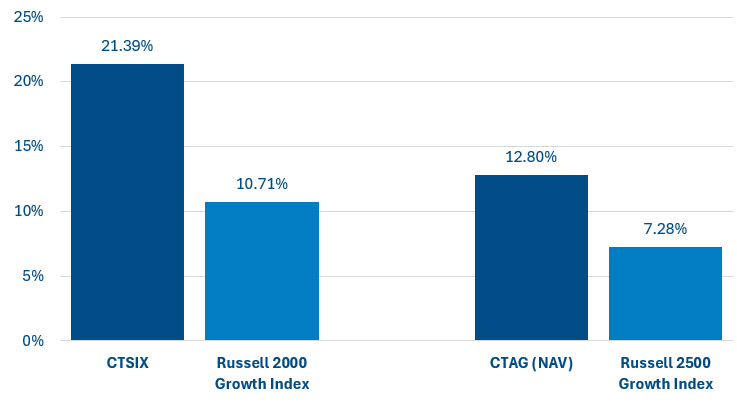
- Year to date, CTAG has outperformed its benchmark by more than 500 basis points; CTSIX is more than 1,000 basis points ahead of its benchmark.
- We believe we are still in an upcycle for our fundamental momentum investment style.
Rising oil prices and bond yields, along with a sharp correction in many AI infrastructure stocks, made for a volatile third quarter. After a strong second quarter, small caps overall struggled, falling 723 basis points and lagging large caps by 903 basis points, as measured by the Russell 2000 Index and Russell 1000 Index, respectively.1
Relative to large caps, small caps are perceived to be disproportionately hurt by rising interest rates, and much of the small-cap weakness is related to investor nervousness about the steadily rising bond yields throughout the quarter. The start of a new Fed tightening cycle in September added to the anxiety, and the market is assuming more rate hikes are on the way.
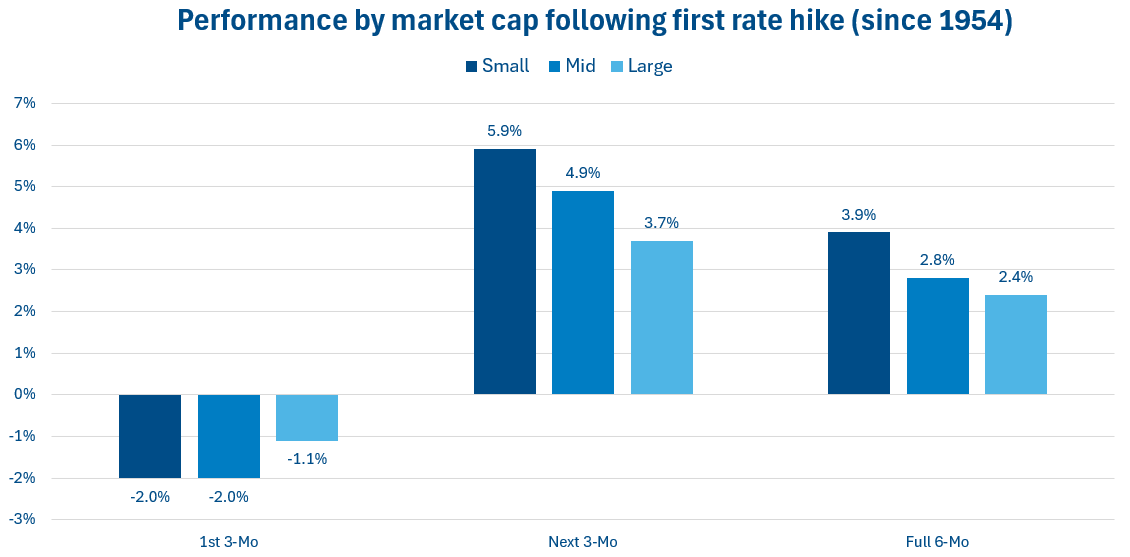
Naturally, this raises the following question: How have small-cap stocks historically performed following the first Fed interest rate hike? This might surprise you … looking at the 13 hiking cycles since 1954, on average, small caps only modestly fall in the three months after the first hike and more than recover that loss in the following three months (see Figure 1). This flies in the face of conventional wisdom that assumes small caps get clobbered during Fed tightening cycles.
Figure 1. Conventional wisdom is wrong: Small-cap underperformance following an initial Fed hike is modest and short-lived
Source: Jefferies as of 9/10/26 using Federal Reserve Board, Haver Analytics, Center for Research in Security Prices (CRSP®), The University of Chicago Booth School of Business, Jefferies. Past performance is no guarantee of future results.
During a rough quarter for small caps, Calamos Timpani Small Cap Growth Fund (CTSIX) and Calamos Timpani Active SMID Growth ETF (CTAG) struggled. Absolute and relative weakness was mostly confined to July, when many AI infrastructure stocks corrected after powerful June quarter moves. We selectively reduced exposure during the quarter but remain overweighted to the AI infrastructure theme because of the robust earnings profiles of our holdings. Our active management during the quarter added value, resulting in performance that was better than the June 30 untouched portfolios.
While third-quarter results were disappointing, we are confident in our process. It was a tricky quarter to navigate, and while we took a hit in July, we made what we believe are some great adjustments. We reacted quickly and regained much of the ground we lost relative to the benchmarks in August and September. Our relative performance was supported by a combination of the stocks we sold dropping further and the ones we bought rising.
Supported by tremendous strength during the second quarter, CTSIX and CTAG remain well ahead of their benchmark performance year to date (Figure 2). In contrast, the average small-cap growth and SMID-cap growth managers are trailing their benchmarks year to date (Figure 3). We believe this speaks to the value of our fundamental momentum investment style and our ability to identify stocks with sustainably fast and underestimated growth.
Figure 2. CTSIX and CTAG year-to-date performance, as of 9/30/26
Source: Morningstar as of 9/30/26. Performance data quoted represents past performance, which is no guarantee of future results. Current performance may be lower or higher than the performance quoted. Please refer to Important Risk Information. For CTSIX, the principal value and return of an investment will fluctuate so that your shares, when redeemed, may be worth more or less than their original cost. All performance shown assumes reinvestment of dividends and capital gains distributions. For CTAG, returns at NAV reflect the deduction of the Fund's management fee and other expenses, which can be found here. You can purchase or sell common shares daily. Like any other stock, the market price will fluctuate with the market. Upon sale, your shares may have a market price that is above or below net asset value and may be worth more or less than your original investment. As of the prospectus dated 2/27/2026, CTSIX’s gross expense ratio is 1.09%. As of the prospectus dated 9/18/2026, CTAG’s expense ratio is 0.79%. For the most recent Fund month end performance information, visit www.calamos.com or call 1-866-363-9219.
Figure 3. Small-cap growth and SMID-cap growth managers have struggled to beat their benchmarks in 2026

Source: Jefferies, 9/30/26, using FactSet, Lipper Analytical Services, FTSE Russell, Jefferies. Past performance is no guarantee of future results.
The third quarter’s pullback was a natural digestion of some big gains. We believe we are still in an upcycle for our investment style and that our team will continue to find favorable setups within that investment framework. And finally, while the past can’t predict the future, we believe it’s worth remembering that small caps have tended to perform well in the fourth quarter, and the overall stock market has tended to perform best in the third year of a presidential term—2027 in this case. Things to keep in mind with all of the negativity in the air.
Total Returns as of 9/30/26
| 3Q 2026 | YTD | 1 Year | 3 Year | 5 Year | 10 Year | Fund Inception | |
|---|---|---|---|---|---|---|---|
| CTSIX | -13.41% | 21.39% | 25.97% | 33.16% | 8.07% | 15.72% | 13.38% (3/23/11) |
| Russell 2000 Growth Index | -9.39% | 10.71% | 12.05% | 17.55% | 4.72% | 9.90% | 10.01% |
| CTAG | -14.53% | 12.80% | 18.33% | 29.18% | 7.54% | — | 12.84% (7/31/19) |
| Russell 2500 Growth Index | -10.35% | 7.28% | 7.63% | 14.91% | 3.46% | — | 8.88% |
Performance data quoted represents past performance, which is no guarantee of future results. Average annual total return measures net investment income and capital gains or losses from portfolio investments as an annualized average. All performance shown assumes reinvestment of dividends and capital gains distributions. Returns of more than one year are annualized.
For CTSIX, the chart shows the performance of the Predecessor Fund’s Institutional Class, which has been adopted by the Class I shares of the Fund for periods prior to the Reorganization. The information shows you how the Predecessor Fund’s performance has varied year by year and provides some indication of the risks of investing in the Fund. The average annual total return table compares the Predecessor Fund’s Institutional Class performance, adopted by the Fund’s Class I shares, and Class Y performance, adopted by the Fund’s Class A shares and adjusted to reflect the maximum sales load of 4.75%, to that of the Russell 2000 Growth Index. "Since Inception" return shown for the Russell 2000 Growth Index is the return since the inception of the Predecessor Fund’s Class Y shares. An index reflects no deduction for fees, expenses or taxes. To the extent that dividends and distributions have been paid by the Predecessor Fund, the performance information for the Predecessor Fund in the chart and table assumes reinvestment of dividends and distributions. If the Predecessor Fund’s investment adviser had not waived or reimbursed certain Predecessor Fund expenses during these periods, the Predecessor Fund’s returns would have been lower. As always, please note that the Fund’s past performance (before and after taxes) cannot predict how it will perform in the future.
Class I shares are offered primarily for direct investment by investors through certain tax-exempt retirement plans and by institutional clients, provided such plans or clients have assets of at least $1 million. For eligibility requirements and other available share classes, see the prospectus and other Fund documents at www.calamos.com.
For CTAG, on September 21, 2026, Calamos Timpani Active SMID Growth ETF (the "Fund") acquired the assets and assumed the liabilities of the Calamos Timpani SMID Growth Fund (the "Predecessor Fund") in a reorganization (the "Reorganization"). As a result of the Reorganization, performance prior to the Fund's inception date reflects actual performance and expenses of the Class I shares of the Predecessor Fund, without any adjustments. The Fund has the same investment objective and substantially similar strategies as the Predecessor Fund. However, the Fund has a lower net expense ratio than each share class of the Predecessor Fund. As a result, the performance returns of the Fund for the periods shown would have been different than those of the Predecessor Fund. Had the Predecessor Fund been structured as an ETF, its performance may have differed. You can obtain current performance data by visiting www.Calamos.com.
The Fund's (and Predecessor Fund's) past performance (before and after taxes) is not necessarily an indication of how the Fund will perform in the future.
Before investing, carefully consider the fund’s investment objectives, risks, charges and expenses. Please see the prospectus and summary prospectus containing this and other information which can be obtained by calling 1-866-363-9219. Read it carefully before investing.
Opinions, estimates, forecasts, and statements of financial market trends that are based on current market conditions constitute our judgment and are subject to change without notice. The views and strategies described may not be appropriate for all investors. References to specific securities, asset classes and financial markets are for illustrative purposes only and are not intended to be, and should not be interpreted as, recommendations.
Diversification and asset allocation do not guarantee a profit or protect against a loss.
1 Source for index returns: FTSE Russell. The Russell 2000 Index returned -7.23% for the three months ending September 30, 2026; the Russell 1000 Index returned 1.80%.
The Russell 1000® Index measures the performance of the large-cap segment of the US equity universe. The Russell 2000® Index measures the performance of the small-cap segment of the US equity universe. The Russell 2000® Growth Index measures the performance of the small-cap growth segment of the US equity universe. It includes those Russell 2000® companies with higher price-to-value ratios and higher forecasted growth values. The Russell 2500® Growth Index measures the performance of the small to midcap growth segment of the US equity universe. It includes those Russell 2500 companies with higher growth earnings potential.
Morningstar Small Growth Category funds focus on faster-growing companies whose shares are at the lower end of the market-capitalization range. Stocks in the bottom 10% of the capitalization of the US equity market are defined as small cap. Growth is defined based on fast growth (high growth rates for earnings, sales, book value, and cash flow) and high valuations (high price ratios and low dividend yields).
Unmanaged index returns, unlike fund returns, do not reflect fees, expenses or sales charges. Investors cannot invest directly in an index.
Alpha: A historical measure of risk-adjusted performance. Alpha measures how much of a portfolio’s performance is attributable to investment-specific factors versus broad market trends. A positive alpha suggests that the performance of a portfolio was higher than expected given the level of risk in the portfolio. A negative alpha suggests that the performance was less than expected given the risk.
Morningstar Ratings™ are based on risk-adjusted returns and are through 9/30/26 for the share class listed and will differ for other share classes. Morningstar ratings are based on a risk-adjusted return measure that accounts for variation in a fund’s monthly historical performance (reflecting sales charges), placing more emphasis on downward variations and rewarding consistent performance. Within each asset class, the top 10%, the next 22.5%, 35%, 22.5%, and the bottom 10% receive 5, 4, 3, 2 or 1 star, respectively. Each fund is rated exclusively against US domiciled funds. The information contained herein is proprietary to Morningstar and/or its content providers; may not be copied or distributed; and is not warranted to be accurate, complete or timely. Neither Morningstar nor its content providers are responsible for any damages or losses arising from any use of this information. Source: ©2026 Morningstar, Inc.
Important Risk Information. An investment in the Fund(s) is subject to risks, and you could lose money on your investment in the Fund(s). There can be no assurance that the Fund(s) will achieve its investment objective. Your investment in the Fund(s) is not a deposit in a bank and is not insured or guaranteed by the Federal Deposit Insurance Corporation (FDIC) or any other government agency. The risks associated with an investment in the Fund(s) can increase during times of significant market volatility. The Fund(s) also has specific principal risks, which are described below. More detailed information regarding these risks can be found in the Fund’s prospectus.
The principal risks of investing in the Calamos Timpani Small Cap Growth Fund include equity securities risk consisting of market prices declining in general, growth stock risk consisting of the potential increased volatility due to securities trading at higher multiples, and portfolio selection risk. The Fund invests in small-capitalization companies, which are often more volatile and less liquid than investments in larger companies.
Foreign security risk: As a result of political or economic instability in foreign countries, there can be special risks associated with investing in foreign securities, including fluctuations in currency exchange rates, increased price volatility, and difficulty obtaining information. In addition, emerging markets may present additional risk due to the potential for greater economic and political instability in less developed countries.
The principal risks of investing in the Calamos Timpani Active SMID Growth ETF include: American Depositary Receipts risk, authorized participant concentration risk, cash holdings risk, costs of buying and selling fund shares, currency risk, derivatives risk, equity securities risk, foreign securities risk, forward foreign currency contract risk, futures and forward contracts risk, growth stock risk, liquidity risk, market risk, portfolio selection risk, portfolio turnover risk, premium-discount risk, secondary market trading risk, sector risk, securities lending risk, small and mid-sized company stock risk, tax risk, and trading issues risk.
Equity Securities Risk: The securities markets are volatile, and the market prices of the Fund's securities may decline generally. The price of equity securities fluctuates based on changes in a company's financial condition and overall market and economic conditions. If the market prices of the securities owned by the Fund (i.e., the Fund's long position) fall, the value of your investment in the Fund will decline.
Small and Mid-Sized Company Stock Risk: Small to mid-sized company stocks have historically been subject to greater investment risk than large company stocks. The prices of small to mid-sized company stocks tend to be more volatile and less liquid than large company stocks. Small and mid-sized companies may have no or relatively short operating histories, or be newly formed public companies. Some of these companies have aggressive capital structures, including high debt levels, or are involved in rapidly growing or changing industries and/or new technologies, which pose additional risks.
NOT FDIC INSURED | NO BANK GUARANTEE | MAY LOSE VALUE
026077b 1026