 Investment Team Voices Home Page
An Update on Three Dynamics in Emerging Markets
Global Team Perspectives by Nick Niziolek, CFA and Todd Speed, CFA
August 15, 2019
2018 was an unusual year for emerging market equities. From a style perspective, emerging market growth has typically outperformed emerging market value during market drawdowns, but this was not the case in 2018. Despite concerns about escalating trade tensions and decelerating economic activity, value stocks led the way in relative returns, most notably in the second half of last year.
1. Growth Gains Ground on Value
Through the first half of 2019, this trend has reversed and EM growth leads value. We see the potential for further recovery as investors favor long-tail growth franchises in a world where nominal growth is scarce.
EM Growth vs EM Value, YTD and Past Downturns
Total Return %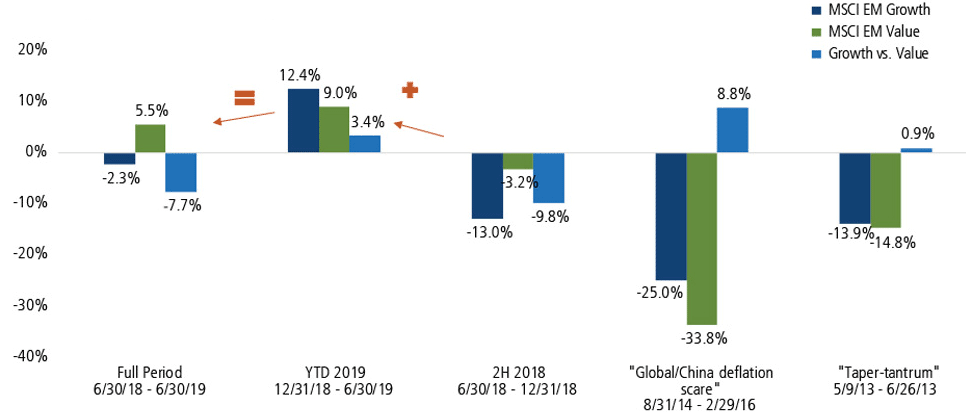
Source: Bloomberg. Data in USD terms. Past performance is no guarantee of future results.
2. Global Companies Rebound
Similarly, 2018 was unusual in that developed market companies and global companies generating significant EM revenues did not outperform during the EM equity market drawdowns, due to weaker EM demand and an uncertain global trade landscape. However, through the first half of 2019, these “global EM revenue stalwarts” have outperformed the MSCI Emerging Market Index.
Performance of DM Companies with Significant EM Revenues vs EM Index
Total Return %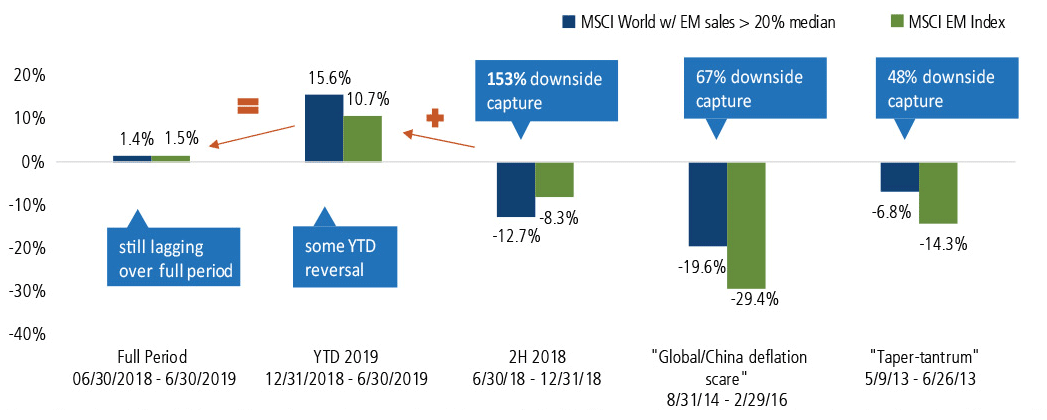
Source: Bloomberg. Data in USD terms. Past performance is no guarantee of future results.
3. Convertible Market Provides Abundant Opportunities for Risk Management
The current volatility spike highlights the importance of risk management in the EM equity space. In a number of strategies, we include convertible securities as a way to participate in growth opportunity with potentially less downside. (Convertible securities tend to be issued by growth-oriented companies, and the structural features of convertibles provide potential downside protection versus equities.) Emerging market convertibles cheapened materially in 2018, widening out beyond other global regions. Asia ex-Japan (AEJ) convertibles recovered some of this gap versus fair value year-to-date and show potential for further recovery. Asian convertible issuance is increasing as a share of the global total, demand for growth capital remains in a range of industries and attractive convertible structures translate to opportunities.
EM Asia Convertibles: Recovery Underway
Convertible Bond Market Cheapness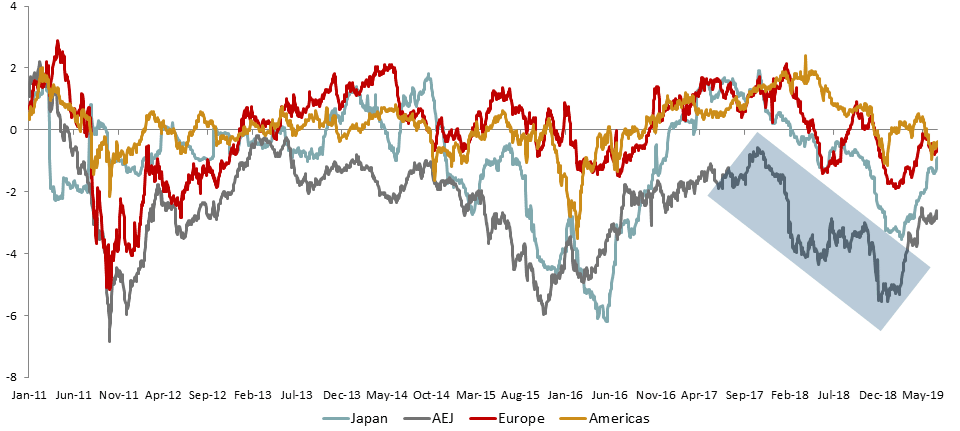
Source: Nomura; Convertible bond market cap weighted average valuation for Tier 1 and Tier 2 Convertible Bonds Only. Valuation: CB Price as % of premium/discount to Nomura Fair Value.
Opinions, estimates, forecasts, and statements of financial market trends that are based on current market conditions constitute our judgment and are subject to change without notice. The views and strategies described may not be suitable for all investors. References to specific securities, asset classes and financial markets are for illustrative purposes only and are not intended to be, and should not be interpreted as, recommendations.
As a result of political or economic instability in foreign countries, there can be special risks associated with investing in foreign securities, including fluctuations in currency exchange rates, increased price volatility and difficulty obtaining information. In addition, emerging markets may present additional risk due to potential for greater economic and political instability in less developed countries.
Convertible securities entail interest rate risk and default risk.
Indexes are unmanaged, do not include fees or expenses and are not available for direct investment. The MSCI Emerging Markets Index is a free float-adjusted market capitalization index that is designed to measure equity market performance of emerging markets. The index is calculated on a total return basis, which includes reinvestment of gross dividends before deduction of withholding taxes. The MSCI Emerging Markets Value Index captures large and mid-cap securities exhibiting overall value style characteristics across 26 EM countries. The MSCI Emerging Markets Growth Index captures large and mid-cap securities exhibiting overall growth style characteristics across 26 EM countries.
18733 0819O C