Investment Team Voices Home Page

Why Growth Stocks Now?

John P. Calamos Sr.

After five years of a strong bull market, I believe there’s still room for stocks to advance. Growth stocks look especially attractive. At 1.23, the premium for growth over value remains lower than the historical average of 1.44. Even when we omit the tech bubble from the long-term average, the 1.23 premium for growth is lower than that 1.37 average.

FIGURE 1. THE VALUE IN GROWTH
THE VALUE IN GROWTH

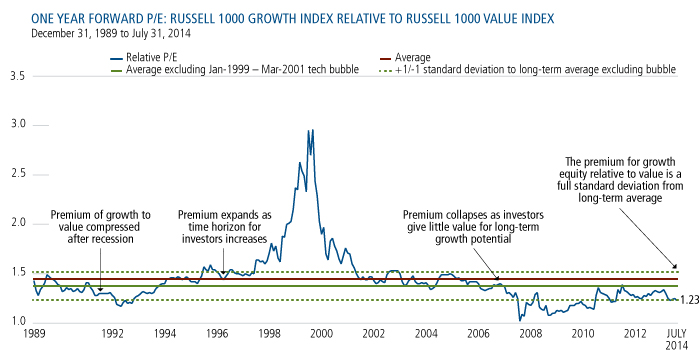
Source: FactSet (1989-6/2012) and CapIQ (7/2012-present). Past performance is no guarantee of future results.

While growth stocks’ prices are low relative to value, their earnings prospects are significantly better. The 5-year forward EPS growth rate for the Russell 1000 Growth Index is 14.76%, versus 8.77% for the Russell 1000 Value Index (Figure 2). As investors move from the "bad news is good news" mindset to "good news is good news," we believe that growth stands to benefit.

FIGURE 2. BRIGHTER EARNINGS PROSPECTS FOR GROWTH
THE VALUE IN GROWTH

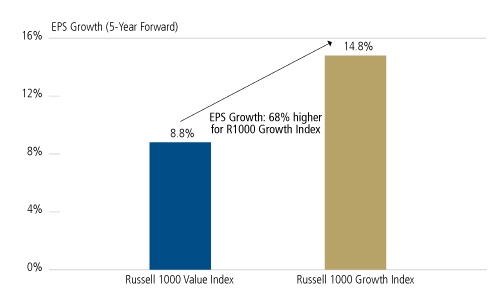
Past performance is no guarantee of future results.Data as of July 31, 2014.

As we’ve discussed in our previous commentaries, we believe that the market has entered a growth regime, and that this current economic expansion cycle will likely be longer than typical—providing a favorable backdrop for growth stocks. Accommodative monetary policy seems set to continue: Last week, the European Central Bank surprised the markets with a rate cut and Friday’s anemic job numbers suggest that the Fed is unlikely to accelerate the pace for a rate increase. But when a rate increase does eventually occur, P/Es are likely to go up as well. History has shown that P/Es go up when interest rates are moving up from abnormally low levels.

No doubt, there will be volatility from economic reports and geopolitics, with Ukraine and the Middle East looming largest today. Active management and a long-term perspective will make the difference in taking advantage of the short-term choppiness that is likely to occur.


    Past performance is no guarantee of future results. The opinions referenced are as of the date of publication and are subject to change due to changes in the market or economic conditions and may not necessarily come to pass. Information contained herein is for informational purposes only and should not be considered investment advice.

    The information in this report should not be considered a recommendation to purchase or sell any particular security. The views and strategies described may not be suitable for all investors.

    The price of equity securities may rise or fall because of changes in the broad market or changes in a company's financial condition, sometimes rapidly or unpredictably. Equity securities are subject to "stock market risk" meaning that stock prices in general (or in particular, the prices of the types of securities in which a fund invests) may decline over short or extended periods of time.

    Russell 1000® Growth Index measures the performance of the large-cap growth segment of the U.S. equity universe. It includes those Russell 1000 companies with higher price-to-book ratios and higher forecasted growth values. Russell 1000® Value Index measures the performance of those companies in the Russell 1000® Index with lower price-to-book ratios and lower forecasted growth values. Indexes are unmanaged, do not include fees or expenses and are not available for direct investment.

    Price to earnings ratio (P/E) is a valuation ratio of a company's current share price compared to its per-share earnings. Earnings per share (EPS) is a company’s profit divided by its number of common outstanding shares. EPS Growth (5 years) represents the weighted earnings per share growth of holdings. Standard deviation is a statistical measure of the historical volatility of a portfolio or group of holdings.

    18037a 0914 0 C