Updated as of December 31, 2016.
This month the Federal Reserve raised the Fed funds rate for the second time in four months, and signaled that two more hikes could be expected this year.
Rising rates typically create significant headwinds for traditional fixed-income securities such as government bonds and investment grade corporate bonds, leading many financial advisors to look for other options for their clients’ portfolios.
At Calamos, we’ve pioneered the use of convertible securities, which combine characteristics of stocks and traditional fixed-income securities, to diversify an asset allocation beyond stocks and bonds. Convertibles can help manage risk and enhance returns. Most relevant to today: they have outperformed bonds during periods of rising interest rates.
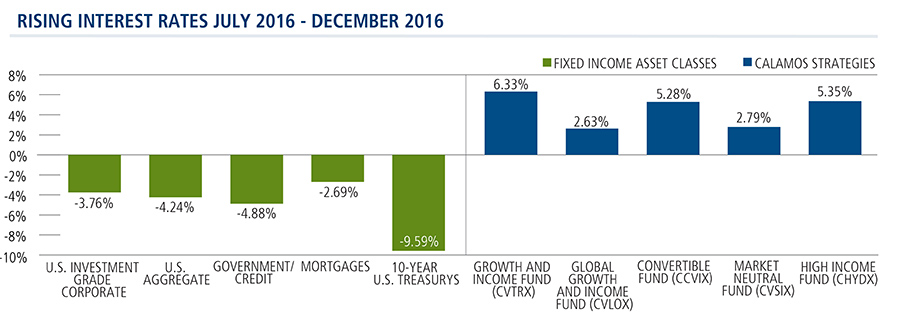
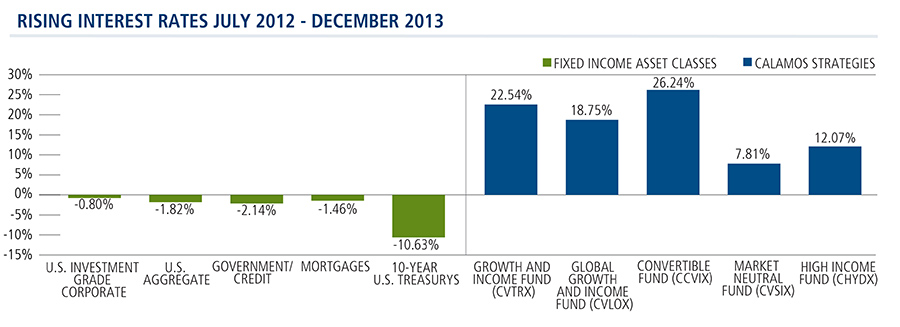
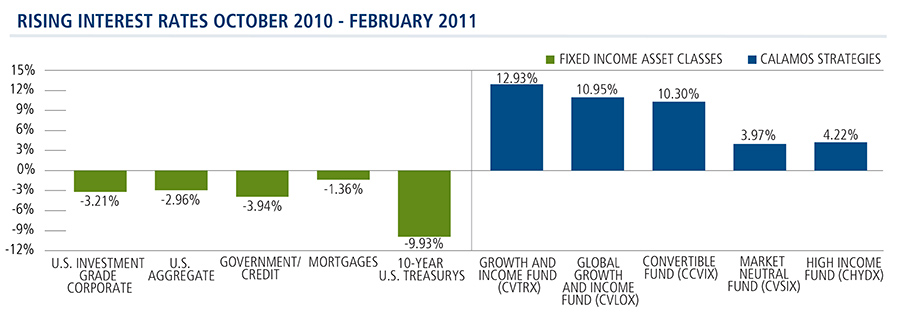
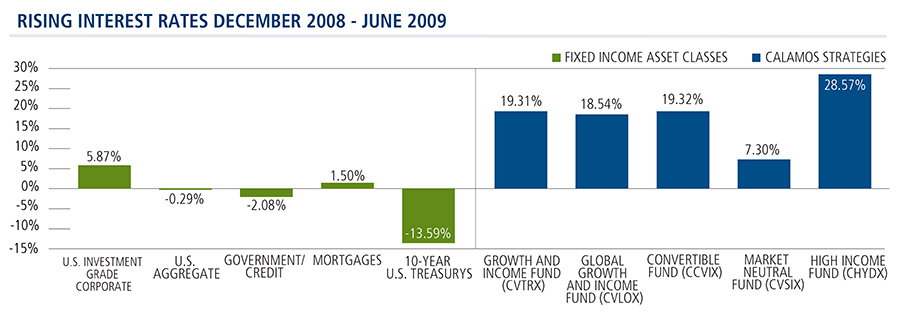
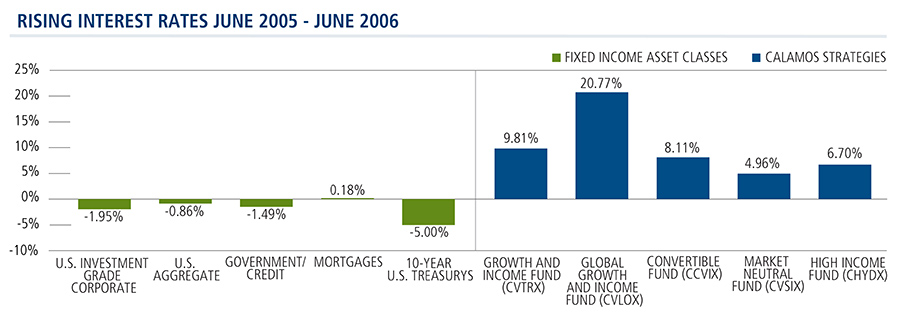
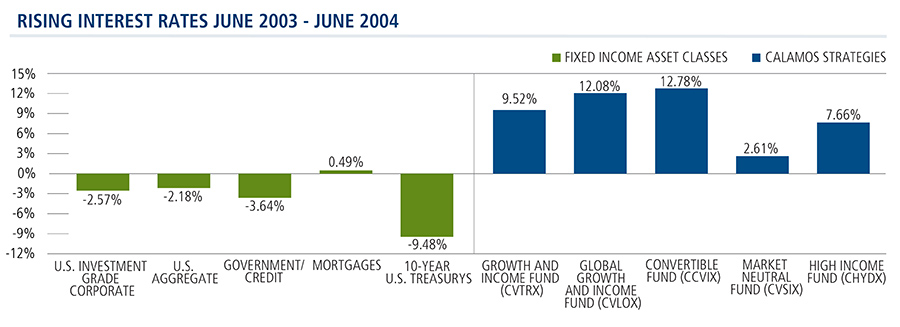
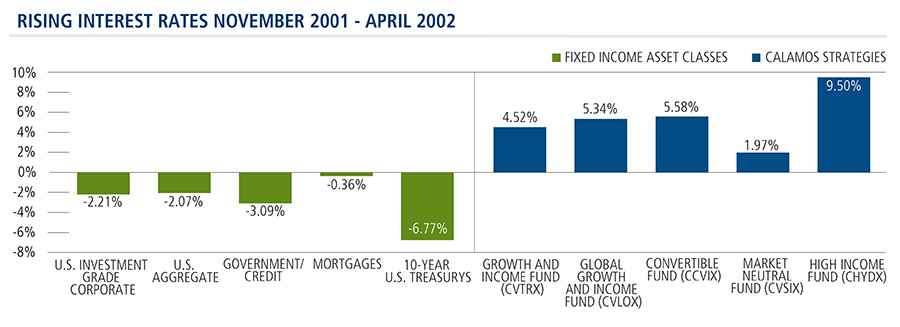
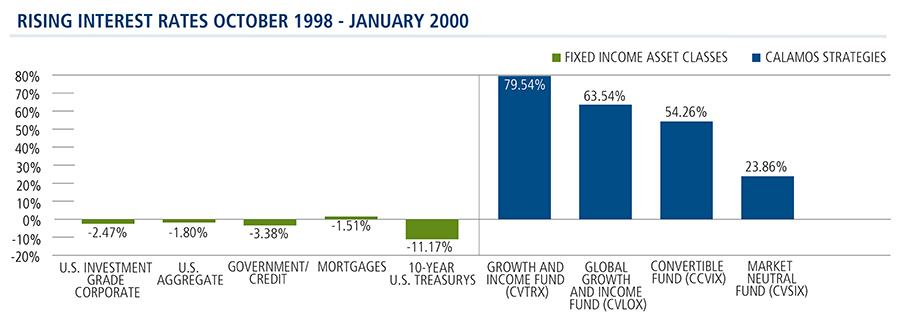
Historical Results During Periods of Rising Rates
Several Calamos strategies have demonstrated notable outperformance in the face of rate increases. The following charts show how over the past 20 years many of our funds have performed versus the broad asset classes when 10-Year Treasury bond yields have risen more than 100 basis points.
Additional Ideas:
How Do Alternative Investments Perform in a Rising Interest Rate Environment?Calamos Strategies for Different Market Periods
Before investing, carefully consider the fund’s investment objectives, risks, charges and expenses. Please see the prospectus and summary prospectus containing this and other information which can be obtained by calling 1-866-363-9219. Read it carefully before investing.
Source: Morningstar and Bloomberg.
Data as of 12/31/16.
Performance data quoted represents past performance, which is no guarantee of future results. Current performance may be lower or higher than the performance quoted. The principal value and investment return of an investment will fluctuate so that your shares, when redeemed, may be worth more or less than their original cost.
There is no assurance the Fund will achieve or maintain its investment objective.
Rising rate environment periods from troughs to peak from January 1996 to December 2016.
10-Year Treasury Yields represented by the 10-Year Treasury Constant Maturity Rate. U.S. corporate investment grade bonds represented by the BofA Merrill Lynch U.S. Corporate Master Index. U.S. aggregate bonds represented by the Bloomberg Barclays U.S. Aggregate Bond Index. Government/ credit represented by the Bloomberg Barclays U.S. Government/Credit Index. Mortgages represented by the Bloomberg Barclays U.S. MBS Index. Treasurys and Government credits are obligations of the U.S. Government and may decline in price during periods of rising interest rates. Investment grade corporate securities are subject to credit risk including risk of default. Mortgage securities are subject to credit risk and prepayment risk.
Average annual total return measures net investment income and capital gain or loss from portfolio investments as an annualized average. All performance shown assumes reinvestment of dividends and capital gains distributions. Performance shown is for Class A (or equivalent) shares at net asset value and do not take into account any sales loads. Performance would have been reduced had such loads been included. The Funds offer multiple other share classes, the performance of which may vary.
Performance data quoteThe standardized performance as of 12/31/16 for the Growth and Income Fund A-shares for YTD, 1, 3, 5, 10, and since inception is 7.21%, 5.35%, 8.16%, 5.49%, and 10.87% respectively. A-Shares load-waived performance for 1, 3, 5, 10, and since inception is 2.12%, 3.65%, 7.11%, 4.98%, and 10.68% respectively.
The standardized performance as of 12/31/16 for the Global Growth and Income Fund A-shares for YTD, 1, 3, 5, 10, and since inception is 0.67%, 1.06%, 4.52%, 3.19%, and 7.53% respectively. A-Shares load-waived performance for 1, 3, 5, 10, and since inception is -4.14%, -0.57%, 3.51%, 2.69%, and 7.28% respectively.
The standardized performance as of 12/31/16 for the Convertible Fund A-shares for YTD, 1, 3, 5, 10, and since inception is 4.39%, 1.76%, 6.01%, 4.51%, and 8.80% respectively. A-Shares load-waived performance for 1, 3, 5, 10, and since inception is -0.56%, 0.12%, 4.98%, 4.00%, and 8.64% respectively.
The standardized performance as of 12/31/16 for the Market Neutral Income Fund A-shares for YTD, 1, 3, 5, 10, and since inception is 4.72%, 2.57%, 3.86%, 3.11%, and 6.38% respectively. A-Shares load-waived performance for 1, 3, 5, 10, and since inception is -0.29%, 0.91%, 2.86%, 2.62%, and 6.18% respectively.
The standardized performance as of 12/31/16 for the High Income Fund A-shares for YTD, 1, 3, 5, 10, and since inception is 11.93%, 2.48%, 4.90%, 4.95%, and 6.13% respectively. A-Shares load-waived performance for 1, 3, 5, 10, and since inception is 6.58%, 0.82%, 3.90%, 4.44%, and 5.84% respectively.
Performance data quoted represents past performance, which is no guarantee of future results. Current performance may be lower or higher than the performance quoted. The principal value and investment return of an investment will fluctuate so that your shares, when redeemed, may be worth more or less than their original cost. You can obtain performance data current to the most recent month end by visiting www.calamos.com. Average annual total return measures net investment income and capital gain or loss from portfolio investments as an annualized average assuming reinvestment of dividends and capital gains distributions. Load adjusted returns are adjusted for the maximum front-end sales load of 4.75% for Class A shares. The funds’ gross expense ratios as of the prospectus dated 2/29/16 are as follows: Growth and Income A 1.11%, Global Growth and Income A 1.49%, Convertible A 1.13%, Market Neutral Income A 1.23% and High Income A 1.29%.
Important Information About Risk: An investment in the Fund(s) is subject to risks, and you could lose money on your investment in the Fund(s). There can be no assurance that the Fund(s) will achieve its investment objective. Your investment in the Fund(s) is not a deposit in a bank and is not insured or guaranteed by the Federal Deposit Insurance Corporation (FDIC) or any other government agency. The risks associated with an investment in the Fund(s) can increase during times of significant market volatility. More detailed information regarding these risks can be found in the Fund’s prospectus.
The principal risks of investing in the Fund(s) include: Convertible Fund: convertible securities risk, synthetic convertible instruments risk, foreign securities risk, equity securities risk, interest rate risk, credit risk, high yield risk and portfolio selection risk; Global Growth and Income Fund: convertible securities risk, synthetic convertible instruments risk, foreign securities risk, emerging markets risk, equity securities risk, growth stock risk, interest rate risk, credit risk, high yield risk and portfolio selection risk; Growth and Income Fund: convertible securities risk, synthetic convertible instruments risk, equity securities risk, growth stock risk, small and mid-sized company risk, interest rate risk, credit risk, high yield risk and portfolio selection risk; High Income Fund: high yield risk, convertible securities risk, synthetic convertible instruments risk, interest rate risk, credit risk, liquidity risk and portfolio selection risk; Market Neutral Income Fund: convertible securities risk, synthetic convertible instruments risk, convertible hedging risk, covered call writing risk, options risk, short sale risk, interest rate risk, credit risk, high yield risk, liquidity risk and portfolio selection risk.
As a result of political or economic instability in foreign countries, there can be special risks associated with investing in foreign securities, including fluctuations in currency exchange rates, increased price volatility and difficulty obtaining information. In addition, emerging markets may present additional risk due to potential for greater economic and political instability in less developed countries.
The BofA Merrill Lynch U.S. Corporate Master Index tracks the performance of US dollar denominated investment grade rated corporate debt publically issued in the U.S. domestic market.
The Bloomberg Barclays U.S. Aggregate Bond Index consists of Treasury’s, government related, corporate, mortgage-backed, asset-backed and commercial mortgage securities.
The Bloomberg Barclays U.S. Government/Credit Index is comprised of long-term government and investment grade corporate debt securities.
The Bloomberg Barclays U.S. MBS Index consists of securitized residential mortgages.
Unmanaged index returns assume reinvestment of any and all distributions and, unlike fund returns, do not reflect fees, expenses or sales charges. Investors cannot invest directly in an index.
NOT FDIC INSURED | MAY LOSE VALUE | NO BANK GUARANTEE