Two consecutive years—2018 and 2017—could not have been more different: While 2017 set a record for intraday volatility, with 95% of trading days in the Dow experiencing a range (high to low) of less than 1%, 2018 reminded investors that markets go two ways—and repeatedly. With three S&P 500 declines of more than 5%, the markets in 2018 provided plenty of opportunity for liquid alternatives to deliver as promised. Did liquid alts improve the risk-adjusted returns of a traditional 60/40 portfolio in 2018? Some did (see Our Alternatives Work).
Every week the Calamos Alternatives Snapshot tracks flows and returns of Morningstar U.S. fund alternative categories as well as the Convertibles category.
The 2018 year-end issue of our weekly Calamos Alternatives Snapshot shows:
- In flows-gathering, it was the Nontraditional Bond category that led half the year (26 weeks) followed by the Commodities Broad category (six weeks).
- The weekly returns of the Bear Market category topped the list the most often (15 weeks), followed by Energy LPs (14 weeks). And, it was the Bear Market category that finished 2018 on top with a return of 8.66%, followed by Multicurrency whose return was -0.03%. Compare these to the S&P 500 return of -4.38% and the 0.01% return of the Bloomberg Barclays Capital U.S. Aggregate Bond Index.
Download the issue now for more data and subscribe here to start your own weekly subscription.
Interactive Chart for Added Insight
Anyone who lived through 2018 knows that the year-end data doesn’t fully capture the story of the rollercoaster year.
Use the interactive chart below to see the pace of both the returns and the flows as the year progressed.
The Nontraditional Bond category contains funds that pursue strategies divergent in one or more ways from conventional practice in the broader bond-fund universe.
Multialternative funds offer investors exposure to several different alternative investment tactics. Funds in this category have a majority of their assets exposed to alternative strategies.
Bear Market funds dedicate a majority of the fund’s assets to equities. Most of the portfolio is dedicated to short stock positions in an attempt to take advantage of anticipated market or stock declines.
Managed Futures funds primarily trade liquid global futures, options, swaps, and foreign exchange contracts, both listed and over-the-counter.
Commodities Broad-basket portfolios can invest in a diversified basket of commodity goods including but not limited to grains, minerals, metals, livestock, cotton, oils, sugar, coffee, and cocoa.
Commodities Precious Metals can invest in precious metals such as gold, silver, platinum, and palladium.
Energy Limited Partnership strategies invest a significant amount of their portfolio in energy master limited partnerships, also known as MLPs.
Multicurrency portfolios invest in multiple currencies through the use of short-term money market instruments; derivative instruments including and not limited to forward currency contracts, index swaps, and options; and cash deposits.
Market Neutral funds attempt to reduce systematic risk created by factors such as exposures to sectors, market-cap ranges, investment styles, currencies, and/or countries.
Real Estate portfolios invest primarily in real estate investment trusts of various types. REITs are companies that develop and manage real estate properties.
Convertible-bond portfolios are designed to offer some of the capital-appreciation potential of stock portfolios while also supplying some of the safety and yield of bond portfolios.
Options-based funds use options as a central component of their investment strategies.
Long-short credit funds seek to profit from changes in the credit conditions of individual bond issuers and credit market segments represented by credit indexes.
Long-short equity funds hold sizeable stakes in both long and short positions in equities, exchange traded funds, and related derivatives.
The S&P 500 Index is considered generally representative of the U.S. equity market.
The Bloomberg Barclays Capital U.S. Aggregate Bond Index covers the U.S.-denominated, investment-grade, fixed-rate, taxable bond market of SEC registered securities.
The Bloomberg Barclays U.S. Government/Credit Index is comprised of long-term government and investment-grade corporate debt securities and is generally considered representative of the performance of the broad U.S. bond market.
You’ll see, for example,
- That most of the 14 categories posted their deepest negative returns the same week the S&P 500 did. Only the decline of the Energy LPs category (-8.38%) exceeded the S&P drop of 7.03%.
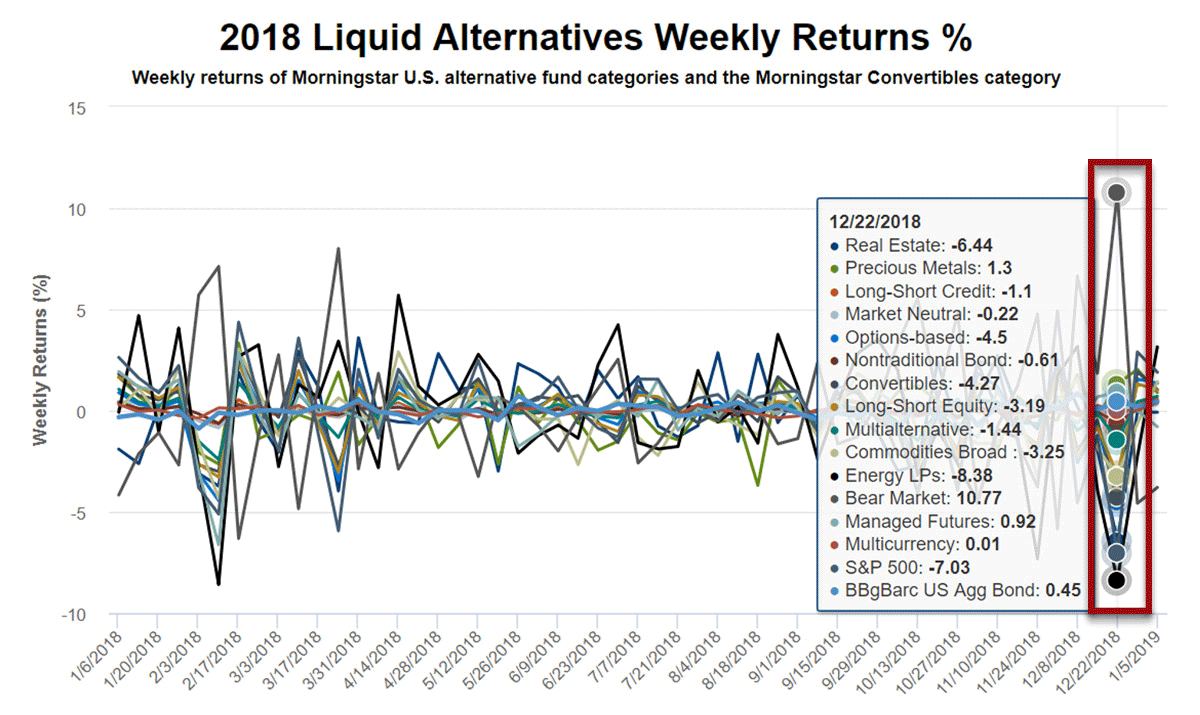
- The top flows-gathering category, Nontraditional Bond was an obvious beneficiary after the February and October plunges. But hide that line and you’ll see low level demand. Long-Short Credit enjoyed an April surge. The Bear Market category spiked in June. Otherwise, not so much.
The Nontraditional Bond category contains funds that pursue strategies divergent in one or more ways from conventional practice in the broader bond-fund universe.
Multialternative funds offer investors exposure to several different alternative investment tactics. Funds in this category have a majority of their assets exposed to alternative strategies.
Bear Market funds dedicate a majority of the fund’s assets to equities. Most of the portfolio is dedicated to short stock positions in an attempt to take advantage of anticipated market or stock declines.
Managed Futures funds primarily trade liquid global futures, options, swaps, and foreign exchange contracts, both listed and over-the-counter.
Commodities Broad-basket portfolios can invest in a diversified basket of commodity goods including but not limited to grains, minerals, metals, livestock, cotton, oils, sugar, coffee, and cocoa.
Commodities Precious Metals can invest in precious metals such as gold, silver, platinum, and palladium.
Energy Limited Partnership strategies invest a significant amount of their portfolio in energy master limited partnerships, also known as MLPs.
Multicurrency portfolios invest in multiple currencies through the use of short-term money market instruments; derivative instruments including and not limited to forward currency contracts, index swaps, and options; and cash deposits.
Market Neutral funds attempt to reduce systematic risk created by factors such as exposures to sectors, market-cap ranges, investment styles, currencies, and/or countries.
Real Estate portfolios invest primarily in real estate investment trusts of various types. REITs are companies that develop and manage real estate properties.
Convertible-bond portfolios are designed to offer some of the capital-appreciation potential of stock portfolios while also supplying some of the safety and yield of bond portfolios.
Options-based funds use options as a central component of their investment strategies.
Long-short credit funds seek to profit from changes in the credit conditions of individual bond issuers and credit market segments represented by credit indexes.
Long-short equity funds hold sizeable stakes in both long and short positions in equities, exchange traded funds, and related derivatives.
The S&P 500 Index is considered generally representative of the U.S. equity market.
The Bloomberg Barclays Capital U.S. Aggregate Bond Index covers the U.S.-denominated, investment-grade, fixed-rate, taxable bond market of SEC registered securities.
The Bloomberg Barclays U.S. Government/Credit Index is comprised of long-term government and investment-grade corporate debt securities and is generally considered representative of the performance of the broad U.S. bond market.
- From its low of -6.31% to its peak of 10.77%, the Bear Market category had the widest performance range. The least: the Multicurrency category.
The data notwithstanding, editorial interest in liquid alternatives and related issues was steady throughout the year. Here’s a quick review of some of the themes we covered in the Weekly Alts Snapshot:
The Liquid Alternatives Space
A handful of metrics are consistently cited when evaluating the health of the liquid alternatives space:
- Fund flows—Having been on an upward trajectory for years, liquid alts reversed course with net outflows starting in 2014. AUM at November 30, 2018, is $157 billion versus its 2014 peak of $190 billion.
- Age of the funds—With so many funds introduced during the extended bull market that followed the Great Financial Crisis, most lack performance records demonstrating success in hostile equity markets. The older the funds, the more time they have to demonstrate the effectiveness of their strategies.
- Number of liquidations vs. launches—Some continue to come while many have come and gone.
Elsewhere: Alternative UCITS have greater AUM (€450 billion) than is invested in half as many U.S. liquid alts, according to a SS&C Technologies, Inc. blog post citing LuxHedge data and reported by us in April. “Respectable returns” and “decent inflows” have helped diminished skepticism overseas.
Meanwhile, the Canadian market in August introduced alternative funds to retail, non-accredited investors, expecting more muted growth than the U.S. in its early days.
While the institutional channel continues to be the most important distribution channel for liquid alts, the retail advisor-sold and high net worth channels are not far behind according to research released by Cerulli Associates in September. Use is particularly strong within retail bank broker-dealers (64% adoption), wirehouses (57%) and hybrid registered investment advisors or RIAs (43%).
Portfolio Diversification
The February 5 simultaneous declines of the S&P 500 and the 10-year Treasury—for just the second time in 16 years—was identified in a Pension Partners blog post we reported on in March.
In November, after February and after October but before December’s rout, we returned to the theme, quoting a November 15 analysis by The Leuthold Group. The performance of a portfolio of equal weights of seven asset classes (large caps, small caps, international, REITs, commodities, 10-year U.S. Treasuries and gold)—a so-called agnostic asset allocation portfolio—fell flat through November and was likely on its way to being just the seventh down year in 46. On average, such a portfolio would have matched the S&P 10.2% annualized return but with much less volatility.
In one of a few 2018 commentaries on liquid alternatives, Morningstar in February suggested ”Today, many investors buy alternatives as a form of insurance against a market correction without realizing that many alternatives are highly correlated with the market.” For example, funds in Morningstar’s Long-Short Equity category have increased their correlation to the S&P 500. (See this Calamos blog post for how our long/short fund has diversified its equity risk, as reflected in its significantly lower correlation to the S&P.)
Consistency of returns is something that many turn to alternative funds for, we noted in April citing data from The Measure of a Plan blog post. Longer time horizons can mute the effect of wild swings.

The 60/40 Portfolio
Bonds, real estate and dividend-paying equities—asset types that investors have counted on to keep portfolios stable when market volatility surges—are not holding up in the way that conservative investors need, according to a CNBC.com post we cited in March. It’s volatility and not rising rates that is the greater risk to investors. Showing a chart isolating stocks’ and bonds’ part in the rolling 30-day standard deviation of a 60/40 portfolio, the post reports that 85% of the volatility came from stocks over the past 20 years.
In October, data from A Wealth of Common Sense blog post raised new concern about the 60/40 portfolio. The traditional portfolio declined 4.73% in October, making it the ninth worst monthly return for a 60/40 portfolio since 2001. In the top 10 worst years, bonds lost ground in only two years and only as much as 2.3% in 1931. The post notes that the biggest short-term risk almost always comes from stocks.
Equity Risk, Market Volatility and the Investor
Equity risk—what some alternatives seek to manage—dominated the year. In February and in December, it was the risk of downside volatility. But in September it was about the risk of not having enough equity exposure. We quoted a post from TheStreet.com: “Understandably the investor sees the stock market reaching new highs, then they look at their portfolios and see either no gains, or a gain considerably lower” than the S&P 500’s 10% return through August 31. Advisors who positioned clients in 60% stocks and 40% in corporate bonds and U.S. Treasuries had produced a return of just 1.3% year to date.
Equity risk is making younger investors even more skittish than prior generations, according to a Gallup poll we cited in June. While more than half (52%) of people younger than 35 were invested in the stock market in 2006-2007 (the years leading up to the financial crisis), just 37% of people in that age range were equity investors this year and last. And, that was up from the low point of 33% in 2013-2014.
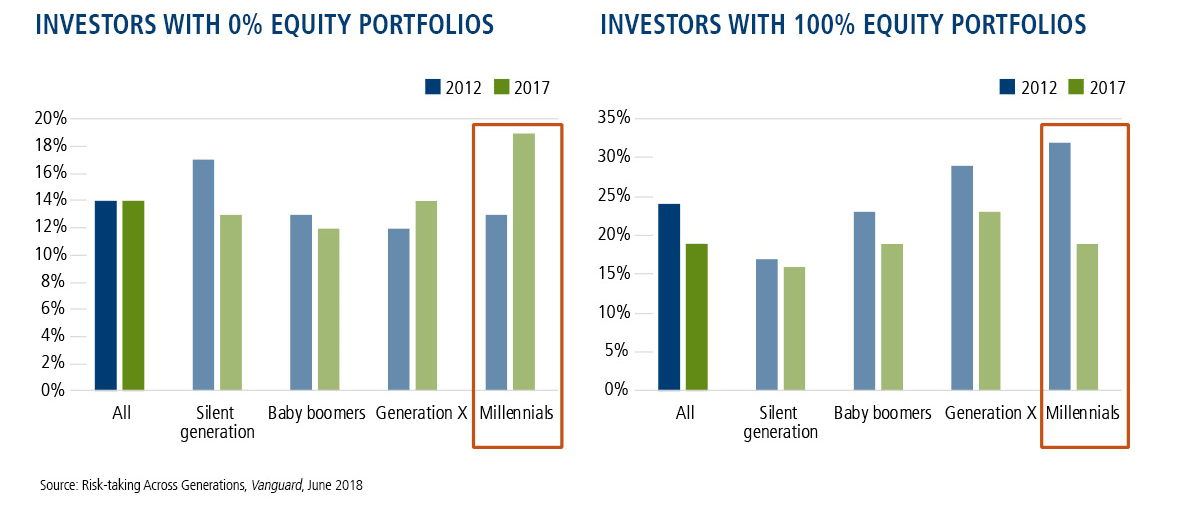
Millennials, the generation with the most time to invest, are the most likely to have zero-equity portfolios and least likely to be 100% invested in equities. This is according to Vanguard research we reported on in September.
Market volatility is increasingly taking shape in the form of bursts—or sudden market plunges, according to an equity derivatives strategist quoted in MarketWatch and cited by us in October. There have been six times when the ratio of five-day to three-month realized volatility exceeded three since 2007 versus just five in the preceding 50 years. Changes in the market structure, including the increasing use of and high-frequency trading are partially responsible.
Hedge Funds
Given that hedge funds performance during 2008 gave rise to the popularity of liquid alts, the Snapshot likes to keep up with how hedge funds are faring.
Seward & Kissel reported that 2017 saw the lowest proportion of new stock-oriented hedge funds since at least 2011, we noted in March.
The rise of products that replicate hedge fund strategies at a lower cost for retail investors—also known as liquid alternatives—is adding pressure to the hedge fund industry. The funds “under threat” are believed to be those in the most liquid asset classes with “the most scalable application”—managed futures, long/short equity and event-driven, according to a Callan contributor quoted in FundFire (subscription-required) coverage of the report and mentioned by us in April.
In late November, we reported that hedge funds raised their gross leverage from what had been a one-year low earlier in the month, according to Bloomberg.
The Weekly Alternatives Snapshot reflects Calamos’ commitment to the alts space. Calamos is the fourth largest alternatives manager by assets under management and #1 in alternative flows for 2018 through November 30 (Morningstar data, 11/30/18). Financial advisors, to learn more about our alternative funds, please talk to your Calamos Investment Consultant at 888-571-2567 or email caminfo@calamos.com].