1000 Basis Points: CPLIX’s Q4 Difference
January 11, 2019
How much more can equity investors take? The S&P 500 fell by more than 5% not just once but three times in 2018, and the year ended with the largest weekly outflow in stock funds ($46 billion between Dec. 5 and Dec. 12) since Lipper began tracking weekly flows in 1992.
Financial advisors, whether capital preservation is your top priority right now or you’re focused on risk-adjusted returns over a full market cycle, consider the role that Calamos Phineus Long/Short Fund (CPLIX) can play in your clients’ portfolios.
Further, we can divide the September to December period in two. The S&P struggled most from December 4 to December 24 when it fell -15.64% versus CPLIX's decline of -6.53%.
Earlier, from September 21 to November 23, the S&P dropped -9.88% while CPLIX was down just -3.95%.
Overall, during the stock market drawdown from September to December 2018, CPLIX outperformed the index by more than 1000 basis points (see chart below).

The fund’s differentiation from the Morningstar Long/Short category—CPLIX goes its own way, as suggested in this comparison of its beta versus its long/short equity peers—is a consistent characteristic of the fund. The tendency of the correlation of many long/short funds to have floated much closer to the S&P is what’s prompted Michael Grant, Calamos Co-CIO, Head of Global Long/Short Strategies and Senior Portfolio Manager of CPLIX, to call other long/short funds “long light.”
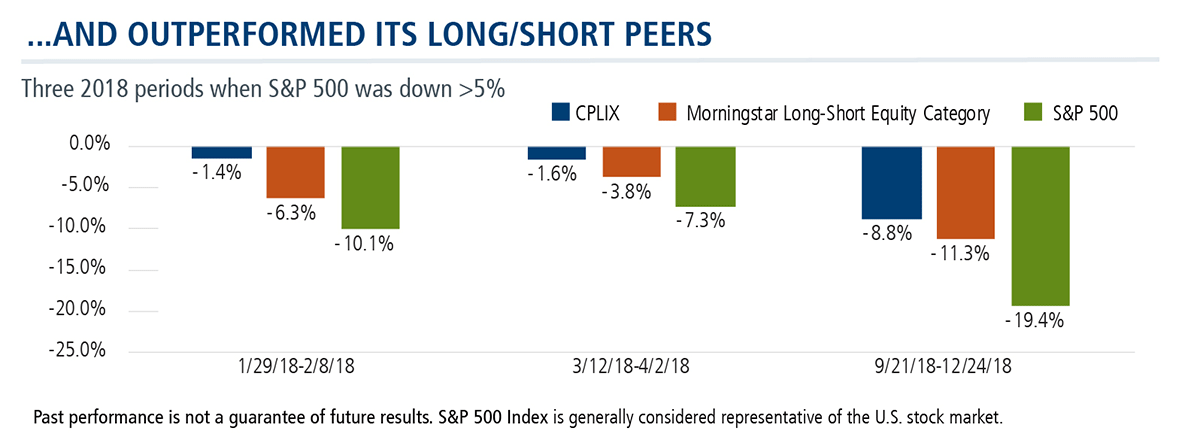
Here’s CPLIX’s performance against its peers in the Morningstar Long-Short Equity category during the selloffs.
Advisors, talk to your Calamos Investment Consultant about why CPLIX has outpaced the S&P 500 since its inception in 2002. He or she can be reached at 888-571-2567 or caminfo@calamos.com.
Calamos was #1 in flows to funds in the Morningstar Alternatives Category in 2018, and ranks fourth on the list of alternative fund managers by assets under management as of 12/31/18.
Click here to view CPLIX's standardized performance.
Before investing, carefully consider the fund’s investment objectives, risks, charges and expenses. Please see the prospectus and summary prospectus containing this and other information which can be obtained by calling 1-866-363-9219. Read it carefully before investing.
An investment in the Fund(s) is subject to risks, and you could lose money on your investment in the Fund(s). There can be no assurance that the Fund(s) will achieve its investment objective. Your investment in the Fund(s) is not a deposit in a bank and is not insured or guaranteed by the Federal Deposit Insurance Corporation (FDIC) or any other government agency. The risks associated with an investment in the Fund(s) can increase during times of significant market volatility. The Fund(s) also has specific principal risks, which are described below. More detailed information regarding these risks can be found in the Fund's prospectus.
The principal risks of investing in Calamos Phineus Long/Short Fund include: equity securities risk consisting of market prices declining in general, short sale risk consisting of potential for unlimited losses, foreign securities risk, currency risk, geographic concentration risk, other investment companies (including ETFs) risk, derivatives risk, options risk, and leverage risk.
Alternative investments are not suitable for all investors.
S&P 500 Index is generally considered representative of the U.S. stock market.
†Morningstar ratings shown are for Class I shares and do not include any front-end sales load. Not all investors have access to or may invest in the share class shown. Other share classes with front-end or back-end sales charges may have different ratings than the ratings shown.
Morningstar Ratings™ are based on risk-adjusted returns for Class I shares and will differ for other share classes. Morningstar ratings are based on a risk adjusted return measure that accounts for variation in a fund’s monthly historical performance (reflecting sales charges), placing more emphasis on downward variations and rewarding consistent performance. Within each asset class, the top 10%, the next 22.5%, 35%, 22.5%, and the bottom 10% receive 5, 4, 3, 2 or 1 star, respectively. Each fund is rated exclusively against U.S. domiciled funds. The information contained herein is proprietary to Morningstar and/or its content providers; may not be copied or distributed; and is not warranted to be accurate, complete or timely. Neither Morningstar nor its content providers are responsible for any damages or losses arising from any use of this information. Source: ©2018 Morningstar, Inc.
Morningstar Long/Short Equity Category funds take a net long stock position, meaning the total market risk from the long positions is not completely offset by the market risk of the short positions. Total return, therefore, is a combination of the return from market exposure (beta) plus any value-added from stock-picking or market-timing (alpha).
©2019 Calamos Investments LLC. All Rights Reserved. Calamos® and Calamos Investments® are registered trademarks of Calamos Investments LLC.
801437 0119 R
Archived material may contain dated performance, risk and other information. Current performance may be lower or higher than the performance quoted in the archived material. For the most recent month-end performance information, please CLICK HERE. Archived material may contain dated opinions and estimates based on our judgment and are subject to change without notice, as are statements of financial market trends, which are based on current market conditions at the time of publishing. We believed the information provided here was reliable, but do not warrant its accuracy or completeness. This material is not intended as an offer or solicitation for the purchase or sale of any financial instrument. The views and strategies described may not be suitable for all investors. This material has been prepared for informational purposes only, and is not intended to provide, and should not be relied on for, accounting, legal or tax advice. References to future returns are not promises or even estimates of actual returns a client portfolio may achieve. Any forecasts contained herein are for illustrative purposes only and are not to be relied upon as advice or interpreted as a recommendation.
Performance data quoted represents past performance, which is no guarantee of future results. Current performance may be lower or higher than the performance quoted. The principal value and return of an investment will fluctuate so that your shares, when redeemed, may be worth more or less than their original cost. Performance reflected at NAV does not include the Fund’s maximum front-end sales load. Had it been included, the Fund’s return would have been lower. For the most recent month-end fund performance information visit www.calamos.com.
Archived material may contain dated performance, risk and other information. Current performance may be lower or higher than the performance quoted in the archived material. For the most recent month-end fund performance information visit www.calamos.com. Archived material may contain dated opinions and estimates based on our judgment and are subject to change without notice, as are statements of financial market trends, which are based on current market conditions at the time of publishing. We believed the information provided here was reliable, but do not warrant its accuracy or completeness. This material is not intended as an offer or solicitation for the purchase or sale of any financial instrument. The views and strategies described may not be suitable for all investors. This material has been prepared for informational purposes only, and is not intended to provide, and should not be relied on for, accounting, legal or tax advice. References to future returns are not promises or even estimates of actual returns a client portfolio may achieve. Any forecasts contained herein are for illustrative purposes only and are not to be relied upon as advice or interpreted as a recommendation.
Performance data quoted represents past performance, which is no guarantee of future results. Current performance may be lower or higher than the performance quoted. The principal value and return of an investment will fluctuate so that your shares, when redeemed, may be worth more or less than their original cost. Performance reflected at NAV does not include the Fund’s maximum front-end sales load. Had it been included, the Fund’s return would have been lower.
Archived on January 11, 2020