 Investment Team Voices Home Page
The Global Opportunity Set Is Growing in 2020
Nick Niziolek, Co-CIO, and the Calamos Global Team
January 14, 2020
The coming year offers many reasons to be optimistic about global opportunities.
- Central banks are increasing liquidity
- Fiscal and monetary policy are pulling in the same direction
- The spending party is a global affair
- A weakening U.S. dollar is a strong tailwind for international outperformance
- Non-U.S. stocks are underowned, attractively valued and positioned for a pickup in earnings
1. Central banks are increasing liquidity
The most significant market event of 2019 was the Fed’s pivot from 2018’s double-barrel interest-rate hike and auto-pilot balance sheet tightening to 2019’s trio of rate cuts and balance sheet expansion.
Changes in Fed policy historically feed through to economy
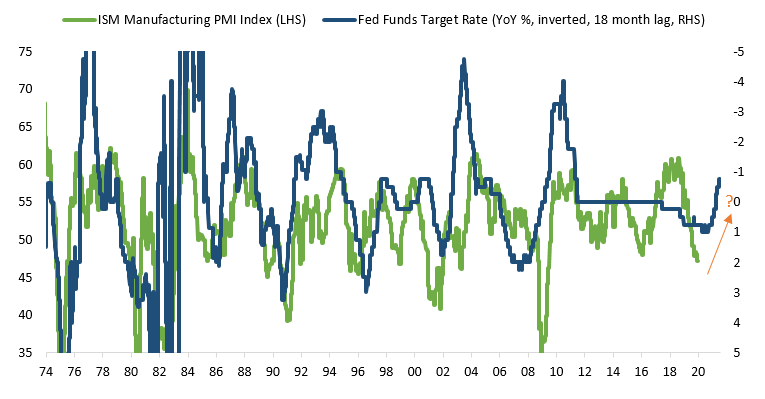
Source: Macrobond.
Why is this pivot in Fed policy so important for the global economy? While we may think three rate cuts moving from ~2.5% to ~1.75% isn’t that significant, these cuts provide meaningful breathing room to overseas central banks. There have been more than 100 interest rate cuts globally since the Fed pivoted to its more accommodative stance, and our expectation is that additional interest rate cuts are on the horizon. As this next chart from J.P. Morgan shows, this sets up well for a rebound in global manufacturing PMI.
Central bank easing: A catalyst for manufacturing PMI
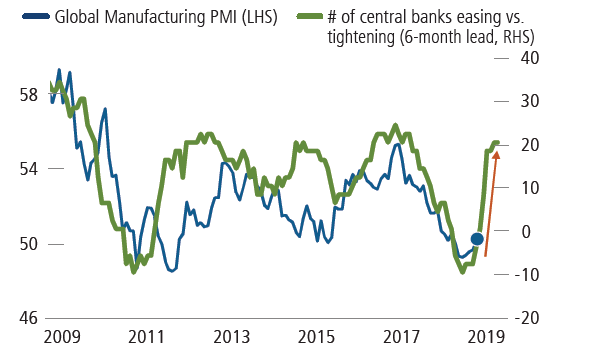
Source: J.P. Morgan Quantitative and Derivatives Strategy, Market and Volatility Commentary, December 9, 2019.
2. U.S. fiscal and monetary policy are pulling in the same direction
Against this backdrop of easy money, fiscal policy is also set to expand, presenting a unique scenario. For the first time in the current cycle, the U.S. Treasury has significantly increased the amount of issuance needed to fund U.S. fiscal deficits at the same time the Fed is increasing its level of Treasury purchases.
U.S. Government spending is ramping up

Source: Gavekal Data/Macrobond
3. The spending party is a global affair
In 2020, we expect to see almost every major global economy implement some form of monetary easing and fiscal support, which historically has resulted in economic improvements. Even Europe has finally joined the spending party, ending the period of fiscal restraint that has characterized much of the last decade.
The chart below illustrates the deficits currently being run by various EU countries as a percentage of GDP. The second chart aggregates these figures, and projects that while China and U.S. expenditures are relatively flat relative to GDP for the next couple years, Europe is actually moving to an aggregate deficit.
Change in cyclically adjusted primary balance, average of OECD and IMF (percentage points of GDP)
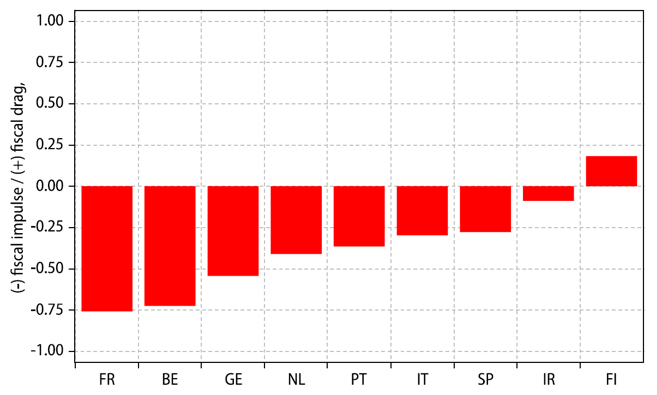
Source: Gavekal Data/Macrobond
General government adjusted primary balance (% of GDP)
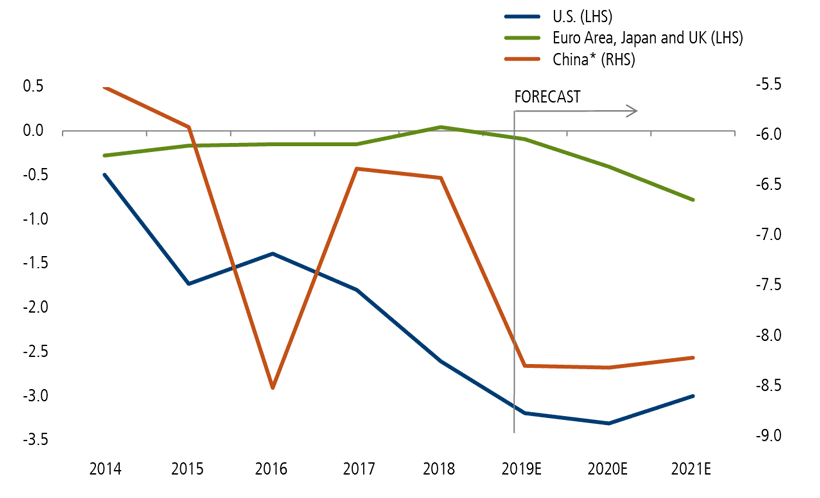
Source: Morgan Stanley, “The Rest of the World is Bouncing Back,” December 12, 2019, using IMF, national sources, Morgan Stanley Research forecasts; *China's cyclically adjusted government primary balance is the cyclically adjusted augmented primary balance including both on-budget and off-budget balances; Note: The euro area, Japan and UK aggregate is the PPP-based GDP weighted average.
Growth in the money supply has typically led to a pickup in the economy. The chart below illustrates that growth of the global money supply is highly correlated to global industrial production, on a six-month lag.
Money supply growth has been a reliable leading indicator of improved global industrial production
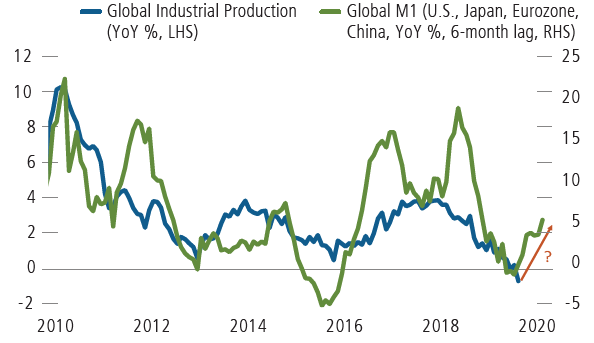
Source: Macrobond
4. A weakening U.S. dollar is a strong tailwind for international outperformance
We believe we are in the process of a U.S. dollar regime change which will be dollar bearish. The U.S. dollar is weakening after an extended leadership cycle. During a dollar bull cycle, U.S markets tend to outperform, whereas in a weaker dollar environment, ex-U.S assets are likely to outperform.
Relative stock price: U.S. versus rest of world
MSCI U.S. Index vs All-Country World ex-U.S. Index in USD terms
MSCI U.S. Index vs All-Country World ex-U.S. Index in USD terms
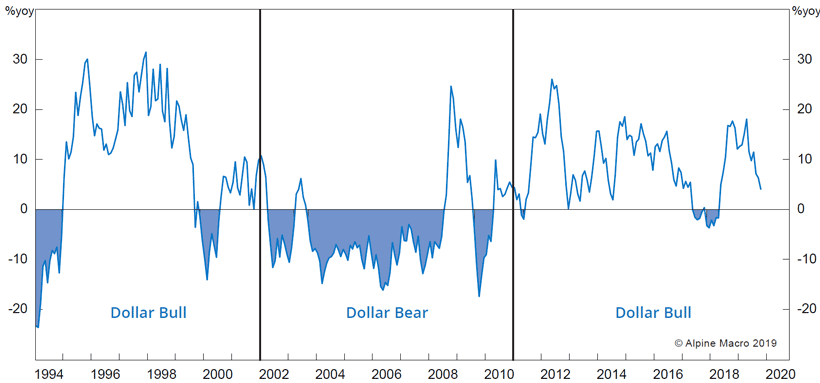
Past performance is no guarantee of future results. Source: Alpine Macro, Global Strategy, “Up The Beta,” November 4, 2019.
As the Fed expands its balance sheet, we expect the U.S. dollar to weaken, as in past Fed asset cycles. It is not coincidental that we’ve started to see the U.S. dollar test the downside of the recent range—it’s more surprising that the dollar hasn’t moved further downward.
Growing Fed balance sheet is likely to coincide with a weaker dollar
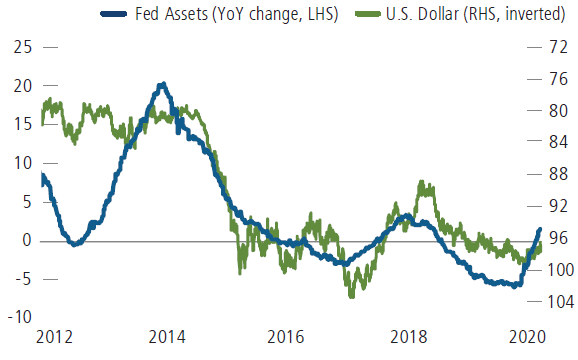
Source: Macrobond. US Dollar represented by DXY Index. Total Fed assets includes securities held in custody for foreign official and international accounts.
5. Non-U.S. stocks are underowned, attractively valued and positioned for a pickup in earnings
Corporate fundamentals and earnings growth will also be key to international market returns. Global and European 2020 earnings growth is estimated to accelerate to levels in-line with the U.S., with emerging markets coming in notably ahead.
Earnings growth, 2019 and 2020 (estimated)
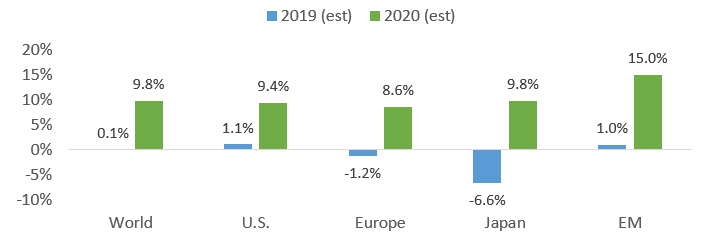
Past performance is no guarantee of future results. Source: Bloomberg, using MSCI Indices for various geographies.
Many investors are under allocated to international stocks, due to a variety of reasons, including a reluctance to rebalance away from the U.S. bull market leadership and for U.S. investors, a more structural “home bias.” Strong U.S. equity returns in 2019 may have reinforced this mindset for many investors, but it sets up for a significant pain trade.
If history is any guide, the combination of rising global liquidity, improving fundamentals, and a weaker dollar can fuel a significant rally in non-U.S. markets in 2020.
Past performance is no guarantee of future results. Opinions, estimates, forecasts, and statements of financial market trends that are based on current market conditions constitute our judgment and are subject to change without notice. The views and strategies described may not be suitable for all investors. References to specific companies, securities, asset classes and financial markets are for illustrative purposes only and are not intended to be, and should not be interpreted as, recommendations to buy or sell. Investing in non-U.S. markets entails greater investment risk, and these risks are greater for emerging markets. The above commentary for informational and educational purposes only and shouldn’t be considered investment advice.
Indexes are unmanaged, do not include fees or expenses and are not available for direct investment. The MSCI U.S. Index, Europe Index, Japan Index and Emerging Market Index are used to represent equity markets of those regions. The MSCI World Index tracks the performance of developed market equities. Indexes are in US Dollar terms. The U.S. Dollar Index measures the value of the U.S. dollar relative to a basket of foreign currencies, including Euro Area, Canada, Japan, United Kingdom, Switzerland, Australia, and Sweden.
18756 0120O