 Investment Team Voices Home Page
Global Opportunities: Japanese Equities
Nick Niziolek, CFA, Dennis Cogan, CFA, Paul Ryndak, CFA, and Kyle Ruge, CFA
January 20, 2022
In this new series, we look forward to sharing our real-time insights about the global markets. Drawing on our global experience and multi-asset-class expertise, we’ll focus on the inflection points and opportunities we see across our vast global investing universe. In this installment, we discuss the opportunities we see in Japan. Although the Japanese equity market has lagged its global peers in recent years, we believe it may be at an inflection point and is worthy of additional focus.
Japan is the second largest country in the MSCI All Country World Index and represents just over 5.5% of the global equity benchmark.* However, the composition of Japan’s equity market looks much different than the broader equity benchmark, which has contributed to Japan’s relative underperformance in recent years.
Following World War II, in what is commonly referred to as its “economic miracle,” Japan experienced several decades of strong export-led growth and became the world’s second largest economy by the late 1980s. Particularly during the later stages of this period, Japan significantly upgraded its industrial base to transition from what was earlier referred to as “the world’s workshop” to a highly innovative and productive global manufacturing center. In the late 1980s, the country experienced a tremendous speculative asset bubble, fueled by a strengthening currency and excessively easy monetary policy. After this bubble burst, Japan endured a debt deflationary spiral that devastated asset prices and set the course for 30 years of anemic economic growth, or the “lost decades.” An aging demographic profile and a variety of policy blunders exacerbated the difficulties. But despite the pain of the past 30 years, Japan remains home to some of the world’s highest quality industrial companies.
In addition to the domestic headwinds Japan has faced, the world has been in a low-growth and low-inflation environment since the global financial crisis. This has benefited companies focused on efficiency, a group that has tended to be heavily skewed toward the IT software, communication services and consumer discretionary sectors. However, an environment in which the outlook for economic growth is improving and inflation is rising will be more beneficial to more traditional manufacturers in the industrials and autos sectors, along with commodities and financials. Japan’s equity market—which remains heavily geared toward manufacturing and exports—could enjoy a powerful boost.
The Japanese equity market’s substantial weighting to more growth-sensitive sectors helps explain some of the underperformance over the past decade. However, this composition also positions the Japanese equity market to outperform if we are entering a period of improving growth and above-trend inflation, which aligns with our outlook.
In addition to benefiting from these global tailwinds, the Japanese equity market should benefit from increased fiscal spending. Japan is one of only a few countries expected to increase fiscal spending in 2022, with expectations for fiscal spending at 10.4% of the country’s GDP. And although US and European monetary policy may tighten in response to the threat of higher inflation, Japan’s policymakers would welcome higher inflation levels, given the country’s history of deflationary pressures and the negative impacts that deflation has had on Japan’s economy. Japan also has been much more conservative than its Western peers in its approach toward Covid-19. A further relaxing of restrictions or confirmation that the virus has become endemic will likely release significant pent-up demand.
Figure 1. Japan’s Equity Market: Positioned to Outperform with Global Recovery
Compared to global and US equity markets, autos and industrials make up a much larger portion of Japan’s equity market. Japan also has significantly more exposure to the economically sensitive materials sector.
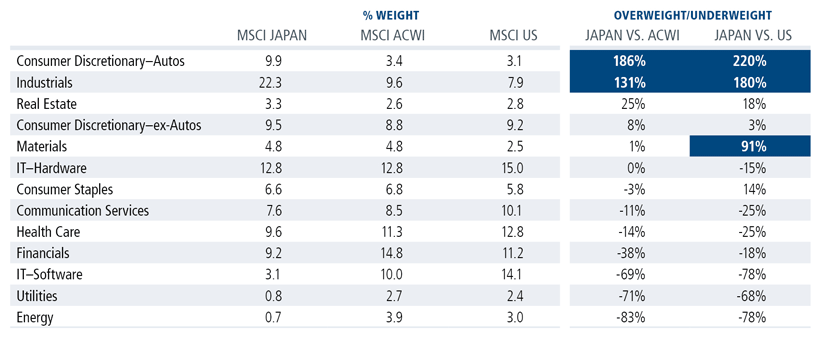
Source: Bloomberg. Data as of January 18, 2022.
The Japanese equity market remains attractively valued, according to a number of measures. For example, the Japanese equity market trades at a much lower multiple than the US equity market (Figure 2), and a substantial percentage of Japanese equities are trading below book value (Figure 3). The Japanese equity market also looks more attractive than those of Europe and the United States based on earnings yields relative to 10-year bond yields (Figure 4).
Figure 2. Japan Equities: Valuation Opportunity
Price-to-earnings multiples for Japan’s equity market are attractive compared to the US. Although growth estimates are muted for Japanese companies overall, we believe they could rise quickly as global growth improves.
| Forward P/E | Trailing P/E | EPS CAGR 2021-2022 | Forward Px/Sales | Trailing Px/Sales | Sales CAGR 2021-2022 | |
|---|---|---|---|---|---|---|
| US (MSCI US Index) | 21.5 | 26.4 | 11.0% | 2.9 | 3.1 | 7.2% |
| Japan (MSCI Japan Index) | 13.6 | 15.0 | 4.9% | 1.0 | 1.1 | 4.7% |
Source: Bloomberg. Data as of January 14, 2022. Past performance is no guarantee of future results. Data in US dollar terms.
Figure 3. More Than Half of Japanese Stocks Are Trading Below Book Value
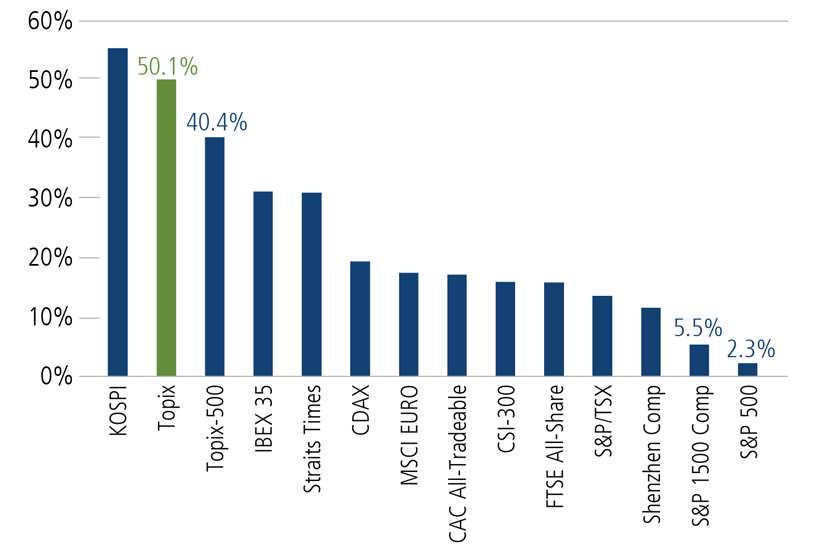
Source: CLSA Benthos, “The great Japanese buyback party,” January 14, 2022, using CLSA and Bloomberg. Past performance is no guarantee of future results.
Figure 4. Japanese Equities: Attractive Multiples Relative to Bond Yields
Earnings yield minus 10-year bond yield (12-month forward earnings)
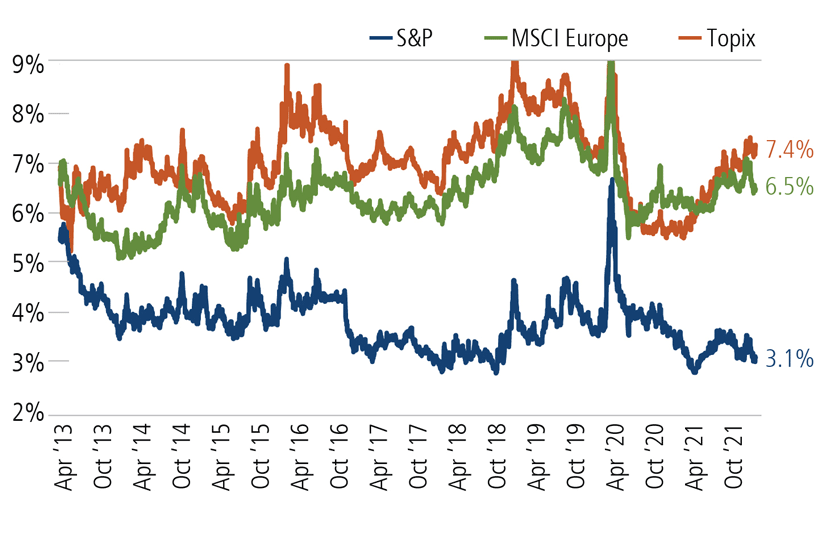
Source: CLSA Benthos, “The great Japanese buyback party,” January 14, 2022, using CLSA and Bloomberg. Past performance is no guarantee of future results.
Although to some extent these valuation differences are attributable to the composition of the Japanese equity market (i.e., fewer high-multiple technology companies and more lower-multiple manufacturing companies), we are identifying many instances where Japanese companies offer better fundamentals and lower valuations than their global peers. For example, the increased worldwide demand for new automobiles and the transition to electric vehicles are providing global opportunities across the sector. However, although they trade at similar earnings multiples as their global peers, Japanese automobile manufacturers have additional margin improvement opportunities that should drive earnings growth above their global peers. In the semiconductor equipment industry, Japanese equities are expected to grow their top- and bottom-lines quicker than their global peers, again while trading at similar multiples.
In addition to more reasonable valuations, many Japanese companies have accumulated large cash reserves and have begun increasing their use of stock buybacks to deploy this capital. An estimated 40% of the nonfinancial stocks in the Topix Index now carry cash in excess of 20% of balance sheet equity (Figure 5), and stock buybacks increased 76% year-over-year during 2021 and 8% above the prior 2019 high water mark (Figure 6).
Figure 5. Japanese Companies Are Cash Rich
Percentage of Topix nonfinancials with excessive net cash greater than 20% of equity
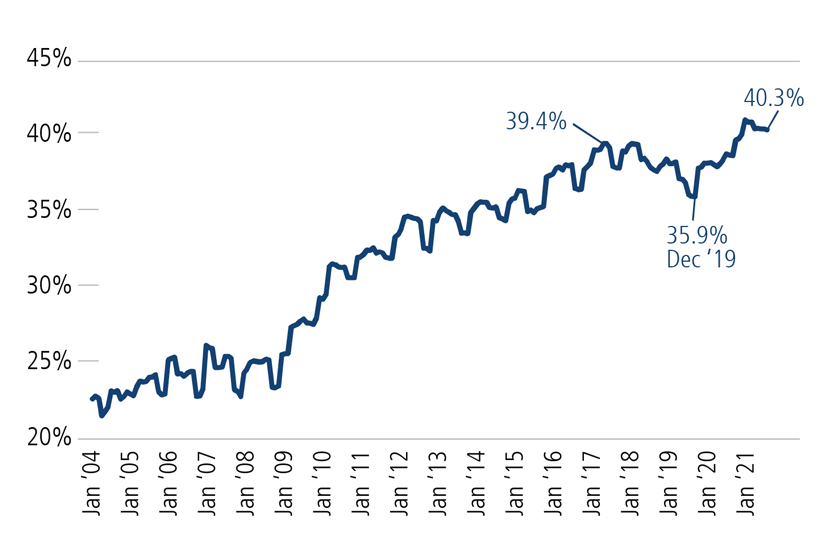
Source: CLSA Benthos, “The great Japanese buyback party,” January 14, 2022, using CLSA and Bloomberg. Past performance is no guarantee of future results.
Figure 6. Topix Share Buybacks Announced
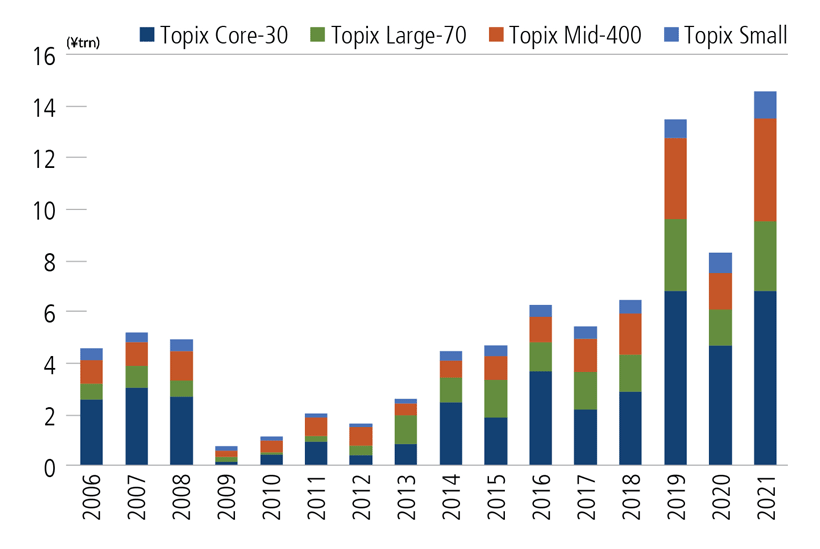
Source: CLSA Benthos, “The great Japanese buyback party,” January 14, 2022, using CLSA and Bloomberg. Past performance is no guarantee of future results.
We believe that 2022 buyback activity will surpass that of 2021, with announcements typically coinciding with the fiscal year-end for Japanese companies, which traditionally occurs in May. To the extent a Japanese company is undervalued relative to its global peers and can use its excess cash reserves to reduce its number of shares, buyback activity should either further increase the valuation disparity versus its global peers or result in a rerating of the companies to the benefit of the existing shareholder base.
In an environment of accelerating global growth, we believe the Japanese equity market is positioned to outperform because of its more cyclically oriented constituency, strong balance sheets and attractive valuations. We continue to research bottom-up ideas in this market that will improve our global and international portfolios, and are we selectively adding exposure as we see further signs of a strengthening global recovery.
Earnings per share (EPS) is a company’s profit divided by its number of outstanding shares. Price-to-earnings ratio (P/E) is a valuation ratio of a company’s current share price compared to its per-share earnings; forward P/Es are based on forecasted earnings. CAGR, or compounded annual growth rate measures year-over-year growth. Price-to-sales ratio measures a company’s stock price versus its revenues.
Indexes are unmanaged, do not include fees or expenses and are not available for direct investment. The Tokyo Price Index—commonly referred to as Topix—is a metric for stock prices on the Tokyo Stock Exchange (TSE). Topix is a capitalization-weighted index that lists all firms in the "first section" of the TSE, a section that organizes all large firms on the exchange into one group. Topix Core 30 Index tracks the performance of 30 stocks in the Topix index that have large market capitalizations and are the most liquid. The Topix Core 70 includes the next 70 most liquid and highly capitalized stocks. The Topix Mid 400 tracks the mid-cap segment of the Topix market. The Topix 500 Index includes the component stocks in the Topix Core 30, the TOPIX Large 70 and the TOPIX Mid 400. The Topix Small Index tracks small cap stocks. The Korea Composite Stock Price Index or KOSPI is the index of all common stocks traded on the Stock Market Division—previously, Korea Stock Exchange—of the Korea Exchange. The IBEX 35 is a measure of Spain’s equity performance. The Straits Times Index measures the performance of equities in Singapore. The CDAX index measure the performance of Germany’s equity market. The CAC measures the performance of France’s equity market. The CSI 300 measures the performance of the top 300 stocks traded on the Shanghai Stock Exchange and the Shenzhen Stock Exchange. The FTSE All Share Index tracks the performance of 600 stocks trading on the London Stock Exchange. The Shenzhen Composite tracks the performance of stocks trading on China’s Shenzhen Stock Exchange. The S&P 1500 Composite tracks the performance of US stocks across the capitalization range. The MSCI US Index is designed to measure the performance of the large and mid cap segments of the US market. The MSCI Japan Index is designed to measure the performance of the large and mid cap segments of the Japanese market. The MSCI Europe Index is designed to measure the performance of the large and mid cap segments of 15 developed markets in Europe. The S&P 500 Index is considered generally representative of the US stock market.
Opinions, estimates, forecasts, and statements of financial market trends that are based on current market conditions constitute our judgment and are subject to change without notice. The views and strategies described may not be appropriate for all investors. References to specific securities, asset classes and financial markets are for illustrative purposes only and are not intended to be, and should not be interpreted as, recommendations.
This material is distributed for informational purposes only. The information contained herein is based on internal research derived from various sources and does not purport to be statements of all material facts relating to the information mentioned and, while not guaranteed as to the accuracy or completeness, has been obtained from sources we believe to be reliable.
References to specific securities, asset classes and financial markets are for illustrative purposes only and are not intended to be, and should not be interpreted as, recommendations.
As a result of political or economic instability in foreign countries, there can be special risks associated with investing in foreign securities, including fluctuations in currency exchange rates, increased price volatility and difficulty obtaining information. In addition, emerging markets may present additional risk due to potential for greater economic and political instability in less developed countries.
* As of January 18, 2022.
18937 0122O C