Expertise, Conviction, Discipline and Results: The CTSIX Approach to Fast-Growing Small Caps
June 3, 2019
Today we’re announcing the availability of Calamos Timpani Small Cap Growth Fund (CTSIX), the result of Calamos’ acquisition of Timpani Capital Management, a boutique small- and smid-cap investment manager based in Milwaukee. The newly named fund maintains its investment team and track record of more than eight years.
Financial advisors may find much to like about CTSIX, including:
-
A long-term specialization in small cap growth companies. Senior Portfolio Manager Brandon Nelson naturally gravitated to small cap stocks years ago.
“Things can go south fast, stories change, fundamentals change, and investors can get blindsided,” Nelson acknowledges in this Q&A. And yet, he says he likes the pressure—and the potential for disproportionate reward.
-
Its investment philosophy. CTSIX combines fundamental research with the analysis of estimate revisions to identify the underestimated growth gap between a company’s business strength and market expectations of that strength. The team’s unemotional, value-added sell discipline is designed to avoid the pitfalls of well documented biases. Read more in the fact sheet.
-
Differentiated active management that has produced benchmark-beating performance since I share inception. From a universe of 1,500 stocks with less than $4 billion market cap, the CTSIX team builds a portfolio of 80-120 fast-growing stocks. To break into the portfolio, a company needs to have established an emerging record of exceeding expectations. To remain in the portfolio, the company needs to have exhibited several quarters of exceeding and raising expectations. Contrast that with the holdings of the Russell 2000, an index that’s reconstituted once a year.
-
The fund’s size. With $76 million in assets, CTSIX is able to take meaningful positions in some of the fastest and smallest growers.
-
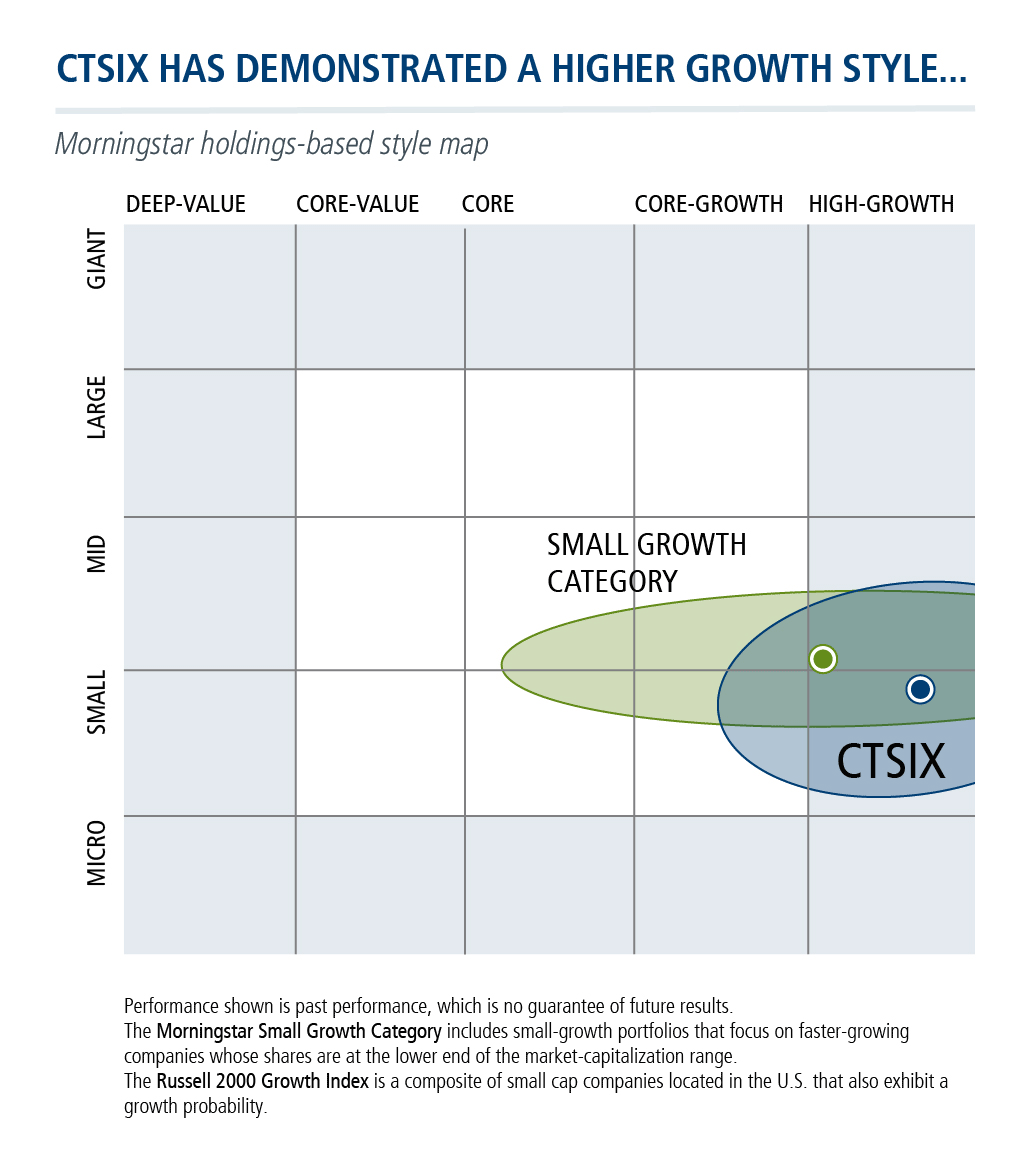
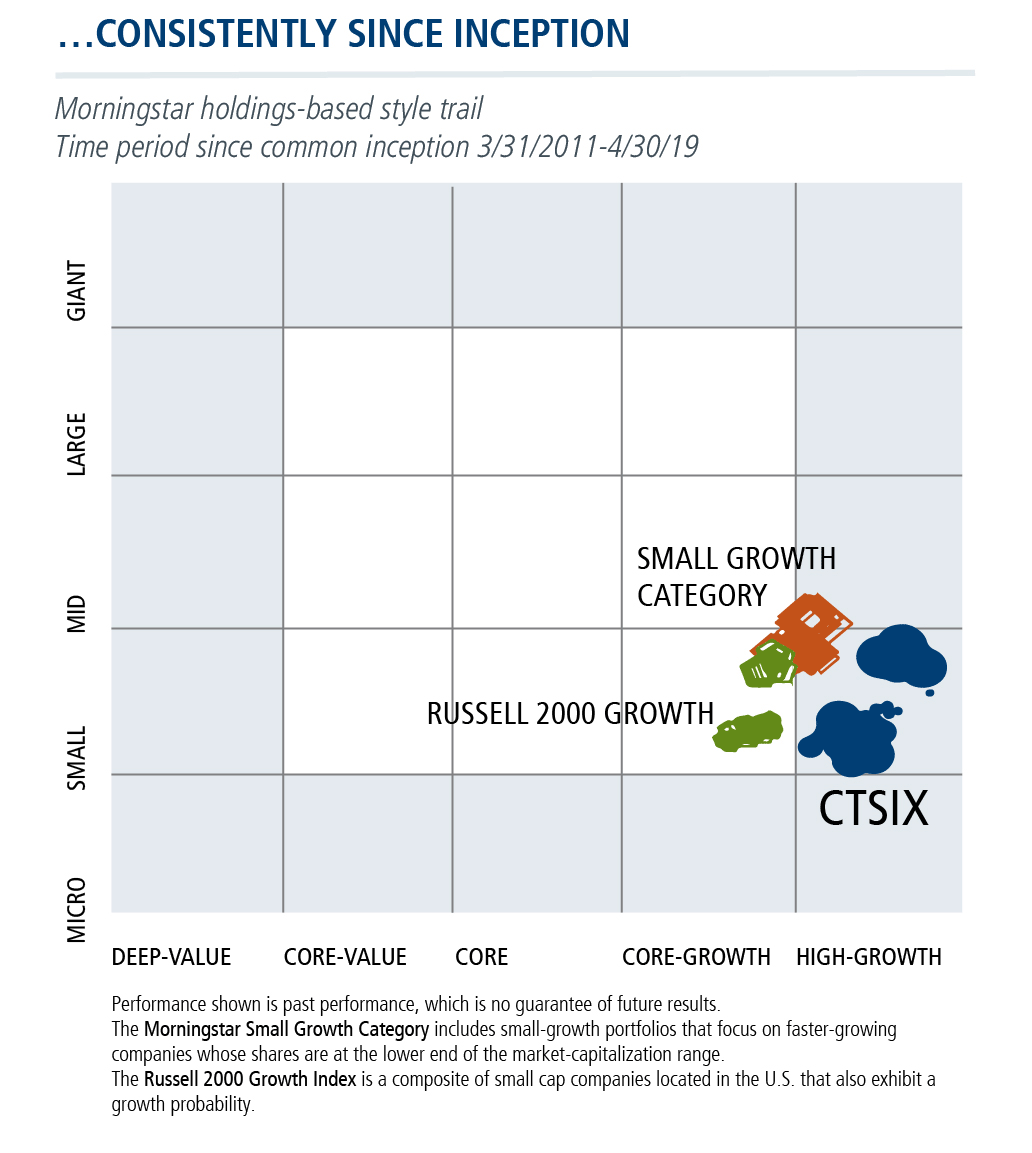
Style fidelity. CTSIX has been parked in the bottom right corner of the Morningstar style box since inception. “Whether fundamental momentum is in vogue or not, we’re not going to deviate from our strategy and our philosophy. And, that’s what our clients have told us that they appreciate most—they know what they’re getting. They know that we’re not going to drift stylistically,” says Nelson.
Advisors, there’s more to say about CTSIX and where it might work for your clients. Talk to your Calamos Investment Consultant at 888-571-2567 or caminfo@calamos.com.
Click here to view CTSIX's standardized performance.
Before investing, carefully consider the fund’s investment objectives, risks, charges and expenses. Please see the prospectus and summary prospectus containing this and other information which can be obtained by calling 1-866-363-9219. Read it carefully before investing.
The performance shown in the bar chart and performance table is the performance of the Predecessor Fund prior to the commencement of the Fund’s operations. Effective as of the close of business on May 31, 2019, the Fund acquired all of the assets, subject to the liabilities, of the Predecessor Fund through a tax-free reorganization (the “Reorganization”). As a result of the Reorganization, the Fund adopted the performance and financial history of the Predecessor Fund. The Fund has the same investment objective, strategy and portfolio manager as the Predecessor Fund. As a result, the performance of the Fund would have been substantially similar to that of the Predecessor Fund.
The bar chart shows the performance of the Predecessor Fund’s Institutional Class which has been adopted by the Class I shares of the Fund for periods prior to the Reorganization. The information shows you how the Predecessor Fund’s performance has varied year by year and provides some indication of the risks of investing in the Fund. The average annual total return table compares the Predecessor Fund’s Institutional Class performance which has been adopted by the Class I shares of the Fund and Class Y performance which has been adopted by the Class A shares of the Fund and adjusted to reflect the maximum sales load of 4.75% for Class A shares, to that of the Russell 2000 Growth Index. “Since Inception” return shown for the Russell 2000 Growth Index is the return since the inception of the Predecessor Fund’s Class Y shares. The average annual total return table does not show performance information for Class R6 shares as the Class R6 shares had not commenced investment operations as of the date of this prospectus. An index reflects no deduction for fees, expenses or taxes. To the extent that dividends and distributions have been paid by the Predecessor Fund, the performance information for the Predecessor Fund in the chart and table assumes reinvestment of the dividends and distributions. If the Predecessor Fund’s investment adviser had not waived or reimbursed certain Predecessor Fund expenses during these periods, the Predecessor Fund’s returns would have been lower. As always, please note that the Fund’s past performance (before and after taxes) cannot predict how it will perform in the future. Updated performance information is available at no cost by visiting www.calamos.com or by calling 800.582.6959.
The principal risks of investing in the Calamos Timpani Small Cap Growth Fund include: equity securities risk consisting of market prices declining in general, growth stock risk consisting of potential increased volatility due to securities trading at higher multiples, and portfolio selection risk.
The Fund invests in small capitalization companies, which are often more volatile and less liquid than investments in larger companies. As a result of political or economic instability in foreign countries, there can be special risks associated with investing in foreign securities, including fluctuations in currency exchange rates, increased price volatility and difficulty obtaining information. In addition, emerging markets may present additional risk due to potential for greater economic and political instability in less developed countries.
The Morningstar Small Growth Category includes small-growth portfolios that focus on faster-growing companies whose shares are at the lower end of the market-capitalization range.
The Russell 2000 Growth Index is a composite of small cap companies located in the U.S. that also exhibit a growth probability.
Unmanaged index returns assume reinvestment of any and all distributions and, unlike fund returns, do not reflect fees, expenses or sales charges. Investors cannot invest directly in an index.
Important Risk Information. An investment in the Fund(s) is subject to risks, and you could lose money on your investment in the Fund(s). There can be no assurance that the Fund(s) will achieve its investment objective. Your investment in the Fund(s) is not a deposit in a bank and is not insured or guaranteed by the Federal Deposit Insurance Corporation (FDIC) or any other government agency. The risks associated with an investment in the Fund(s) can increase during times of significant market volatility. The Fund(s) also has specific principal risks, which are described below. More detailed information regarding these risks can be found in the Fund’s prospectus.
801598 619
Archived material may contain dated performance, risk and other information. Current performance may be lower or higher than the performance quoted in the archived material. For the most recent month-end performance information, please CLICK HERE. Archived material may contain dated opinions and estimates based on our judgment and are subject to change without notice, as are statements of financial market trends, which are based on current market conditions at the time of publishing. We believed the information provided here was reliable, but do not warrant its accuracy or completeness. This material is not intended as an offer or solicitation for the purchase or sale of any financial instrument. The views and strategies described may not be suitable for all investors. This material has been prepared for informational purposes only, and is not intended to provide, and should not be relied on for, accounting, legal or tax advice. References to future returns are not promises or even estimates of actual returns a client portfolio may achieve. Any forecasts contained herein are for illustrative purposes only and are not to be relied upon as advice or interpreted as a recommendation.
Performance data quoted represents past performance, which is no guarantee of future results. Current performance may be lower or higher than the performance quoted. The principal value and return of an investment will fluctuate so that your shares, when redeemed, may be worth more or less than their original cost. Performance reflected at NAV does not include the Fund’s maximum front-end sales load. Had it been included, the Fund’s return would have been lower. For the most recent month-end fund performance information visit www.calamos.com.
Archived material may contain dated performance, risk and other information. Current performance may be lower or higher than the performance quoted in the archived material. For the most recent month-end fund performance information visit www.calamos.com. Archived material may contain dated opinions and estimates based on our judgment and are subject to change without notice, as are statements of financial market trends, which are based on current market conditions at the time of publishing. We believed the information provided here was reliable, but do not warrant its accuracy or completeness. This material is not intended as an offer or solicitation for the purchase or sale of any financial instrument. The views and strategies described may not be suitable for all investors. This material has been prepared for informational purposes only, and is not intended to provide, and should not be relied on for, accounting, legal or tax advice. References to future returns are not promises or even estimates of actual returns a client portfolio may achieve. Any forecasts contained herein are for illustrative purposes only and are not to be relied upon as advice or interpreted as a recommendation.
Performance data quoted represents past performance, which is no guarantee of future results. Current performance may be lower or higher than the performance quoted. The principal value and return of an investment will fluctuate so that your shares, when redeemed, may be worth more or less than their original cost. Performance reflected at NAV does not include the Fund’s maximum front-end sales load. Had it been included, the Fund’s return would have been lower.
Archived on June 02, 2020