Small Caps Are Due to Retake Multi-year Leadership, CTSIX’s Nelson and Royce PM Agree in CE MasterClass
December 27, 2021
Put a small cap growth portfolio manager together with a small cap value portfolio manager, and they can be expected to agree on a few points.
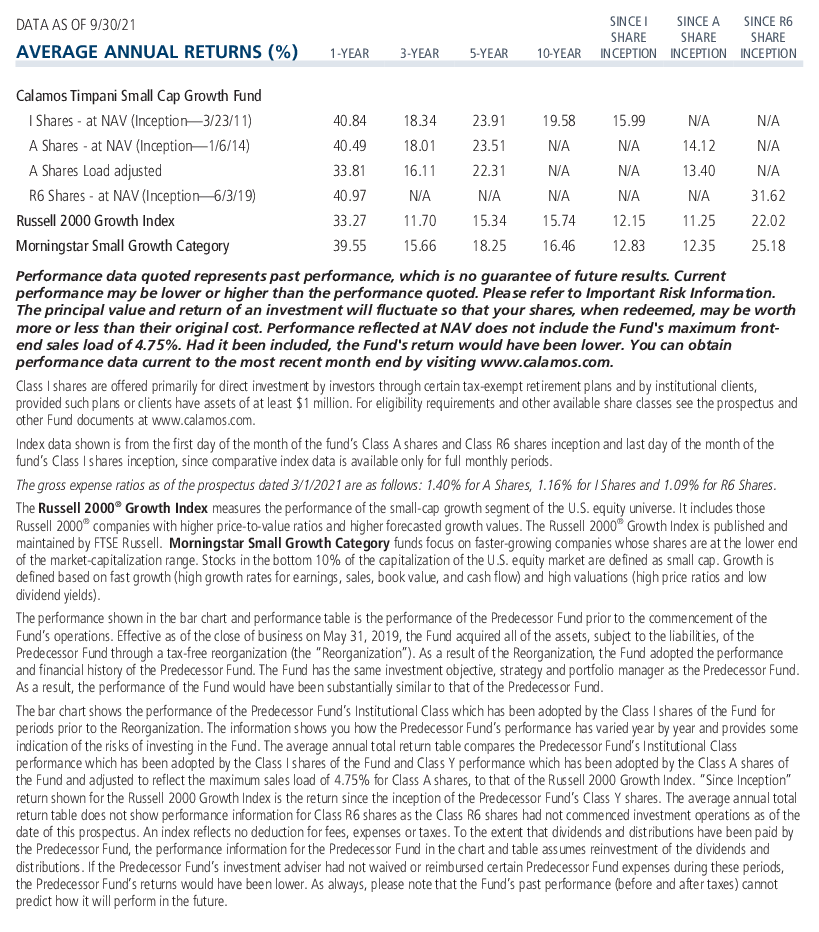
On the benefit of using active management for small caps, for example, Calamos Timpani Small Cap Growth Fund (CTSIX) Senior Portfolio Manager Brandon M. Nelson said, “There's a lot of dead weight in the indexes. If you can find a savvy active manager that knows what they're doing and has a repeatable and proven process, I think you can definitely outperform consistently.” (In fact, CTSIX has outperformed the Russell 2000 Growth Index over all standard time periods, as shown below.)
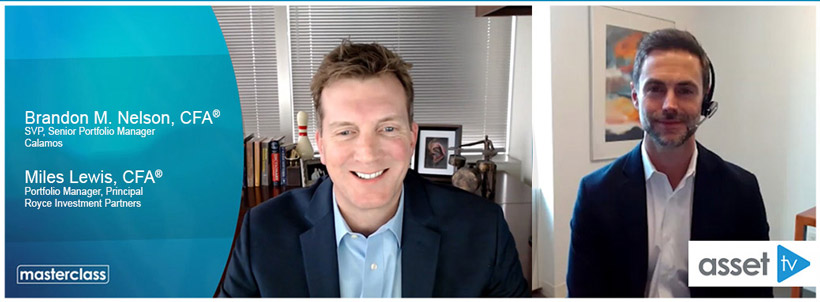
Nelson, appearing alongside Royce Investment Partners Portfolio Manager and Principal Miles Lewis in an Asset TV MasterClass released this week (watch full video here and take the quiz for Continuing Education credit), agreed with Lewis’ description of the structural reasons favoring active small cap managers’ potential to exploit market inefficiencies.
“On our side, on the buy side,” said Lewis, “we can't have an army of 100 analysts going out there and looking at every small cap company because that would require a lot of assets. If we had that many assets, we wouldn't be able to outperform on a relative basis. A similar dynamic exists on the sell side. There's just not the economics for investment banks to have all those analysts looking at [small stocks], given relatively low investment banking and capital markets fees that they get.”
The opportunity, then, Nelson said, is for a bottom-up manager such as CTSIX to find opportunities across multiple sectors and including deep into microcaps.
Small Caps vs. Large Caps
Nelson and Lewis also both said they expect a reversal in small cap performance versus large cap performance to be in the offing.
“The NASDAQ, for example, has a $15 trillion valuation. The entire Russell 2000 Index is $3 trillion. And the Russell 2000 Value Index is about $1.5 trillion. So, capital has flowed very much toward those larger companies,” said Lewis, “and we think over time that results in valuation multiples that get a little bit elevated, and it becomes harder and harder for these large companies to grow into those multiples over time.
“Just the sheer math, right?” continued Nelson. “They're very large companies. It's harder for them to sustain that earnings growth and so they're more susceptible to multiple compression over time.”
With small caps trading at multi-decade lows relative to large caps, Nelson described small company stocks as “a pocket of the investment world that still looks cheap.”
“We're oscillating between the bottom quintile and the second quintile of where small caps normally trade versus large caps. And,” he said, “the data shows that when you are in those two quintiles of valuation where smalls are much less expensive than large, the go-forward performance of small caps tends to be better for the asset class over large caps. The batting average is not 100%, but it's well over 50%.”
The two portfolio managers also stressed the historic long-term outperformance of small companies over large.
According to Nelson, “I think a lot of people don't really understand that small caps do tend to win and people have forgotten that. Large caps have been performing so well for so long that they assume that's normal. The truth is, the long, long term tells you that's not normal and it's more the exception than the rule.”
Both Nelson and Lewis believe that small caps are due for what could be a resumption of multi-year leadership.
And, there was consensus between Nelson and Lewis on the risk that investors run by being underexposed to small caps.
“We could be entering a period here where large caps on an absolute basis sort of flatline,” said Nelson. “Nobody knows for sure how these absolute returns could play out, but what if large caps put up -3% to +3% returns for each of the next three, four years and small caps put up 8% to 10%-plus returns over the next three to five years? That's going to be painful for an [investment professional] whose clients don't have that exposure.”
Where Nelson and Lewis differ, of course, is in how to pursue the potential of small company stocks, and the bulk of the 53-minute video interview focuses on where they see opportunities today. Each presenter covers their process, names specific stocks and weighs in on how the macro can impact small cap prospects.
Investment professionals, for more information about small caps, subscribe to the Calamos Small Cap Market Snapshot. For more information on CTSIX, contact your Calamos Investment Consultant at 888-571-2567 or caminfo@calamos.com.
Before investing, carefully consider the fund’s investment objectives, risks, charges and expenses. Please see the prospectus and summary prospectus containing this and other information which can be obtained by calling 1-866-363-9219. Read it carefully before investing.
Opinions and estimates offered constitute our judgment and are subject to change without notice, as are statements of financial market trends, which are based on current market conditions. We believe the information provided here is reliable, but do not warrant its accuracy or completeness. This material is not intended as an offer or solicitation for the purchase or sale of any financial instrument. The views and strategies described may not be suitable for all investors. This material has been prepared for informational purposes only, and is not intended to provide, and should not be relied on for, accounting, legal or tax advice. References to future returns are not promises or even estimates of actual returns a client portfolio may achieve. Any forecasts contained herein are for illustrative purposes only and are not to be relied upon as advice or interpreted as a recommendation. References to specific securities, asset classes and financial markets are for illustrative purposes only and are not intended to be, and should not be interpreted as, recommendations.
The principal risks of investing in the Calamos Timpani Small Cap Growth Fund include: equity securities risk consisting of market prices declining in general, growth stock risk consisting of potential increased volatility due to securities trading at higher multiples, and portfolio selection risk. The Fund invests in small capitalization companies, which are often more volatile and less liquid than investments in larger companies. As a result of political or economic instability in foreign countries, there can be special risks associated with investing in foreign securities, including fluctuations in currency exchange rates, increased price volatility and difficulty obtaining information. In addition, emerging markets may present additional risk due to potential for greater economic and political instability in less developed countries.
The Russell 2000 Index measures the performance of the 2,000 smallest companies in the Russell 3000 Index, which represents approximately 8% of the total market capitalization of the Russell 3000 Index.
The Russell 2000 Growth Index measures the performance of the small-cap growth segment of the US equity universe. It includes those Russell 2000 companies with higher price-to-value ratios and higher forecasted growth values.
The Russell 2000 Value Index measures the performance of small-cap value segment of the US equity universe. It includes those Russell 2000 companies with lower price-to-book ratios and lower forecasted growth values.
The Nasdaq stock market comprises two separate markets, namely the Nasdaq National Market, which trades large, active securities and the Nasdaq Smallcap Market that trades emerging growth companies.
Archived material may contain dated performance, risk and other information. Current performance may be lower or higher than the performance quoted in the archived material. For the most recent month-end fund performance information visit www.calamos.com. Archived material may contain dated opinions and estimates based on our judgment and are subject to change without notice, as are statements of financial market trends, which are based on current market conditions at the time of publishing. We believed the information provided here was reliable, but do not warrant its accuracy or completeness. This material is not intended as an offer or solicitation for the purchase or sale of any financial instrument. The views and strategies described may not be suitable for all investors. This material has been prepared for informational purposes only, and is not intended to provide, and should not be relied on for, accounting, legal or tax advice. References to future returns are not promises or even estimates of actual returns a client portfolio may achieve. Any forecasts contained herein are for illustrative purposes only and are not to be relied upon as advice or interpreted as a recommendation.
Performance data quoted represents past performance, which is no guarantee of future results. Current performance may be lower or higher than the performance quoted. The principal value and return of an investment will fluctuate so that your shares, when redeemed, may be worth more or less than their original cost. Performance reflected at NAV does not include the Fund’s maximum front-end sales load. Had it been included, the Fund’s return would have been lower.
Archived on December 27, 2022