Pullback Over, Now’s the Time to Believe in Small Caps
July 13, 2021
The unique appeal of small caps right now? “Business is booming, it doesn’t matter what sector, there are so many catalysts driving growth and,” says Brandon M. Nelson, “they’re really cheap relative to large caps.”
Small caps are so attractively priced that Senior Portfolio Manager Nelson has been steadily adding to his own personal stake in Calamos Timpani Small Cap Growth Fund (CTSIX).
“The team and I eat our own cooking, and we really like what we see right now,” he said at a recent meeting as he shared a few less well known aspects about the fund.
To Recap
Since last year—a year the fund ended with a 63% return—Nelson has emphasized four themes about small caps:
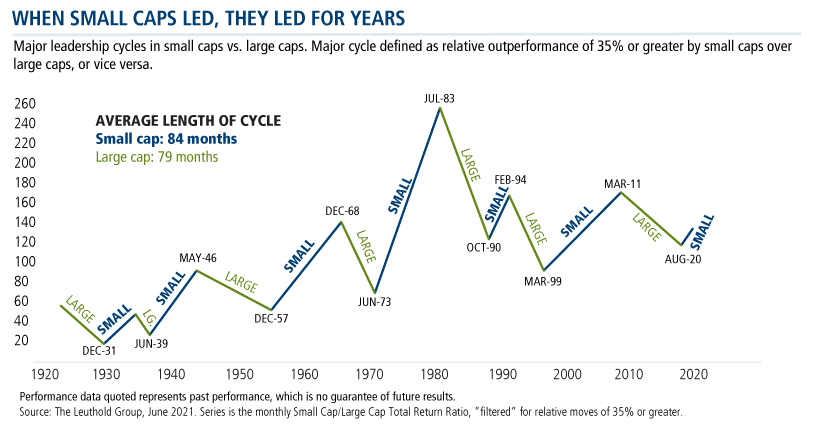
- The length of their leadership historically when small caps have led large caps
- The growth potential small caps offer post-pandemic
- Small caps’ inexpensive valuations relative to large caps’
- The differentiated capability of the CTSIX team to identify winners while limiting losses, resulting in the fund’s near- and long-term record of outperformance
We’ll briefly revisit each below.
Small cap leadership. When small caps have led, they’ve led for an average of seven years and for a minimum of three.
Small caps’ growth potential. Last week, The Wall Street Journal weighed in on the prospects of the current small cap rally extending. This is based on analyst forecasts of a “dramatic revival” in the profits of smaller companies.
“Analysts expect companies in the Russell 2000 to report that their earnings have more than tripled in the just-ended second quarter from a year earlier, according to Refinitiv. Due to pandemic shutdowns, many companies struggled in last year’s second quarter. S&P 500 earnings, by comparison, are projected to have grown about 65%,” The Journal reported.
“Outsize earnings growth” is expected to result in Russell 2000 profits quadrupling versus the third quarter of 2020 while S&P 500 earnings are projected to rise about 25%.
Small cap valuations. The Journal cited the Russell 2000 trading at the end of June at 17.7 times its projected earnings over the next 12 months versus 21.5 times for the Russell 1000 Index, based on BofA Global Research data.
In a shout-out to Nelson as a “believer,” the paper quoted him: “Anytime you can find an asset that has fantastic fundamentals and it’s inexpensive, you should jump all over that.”
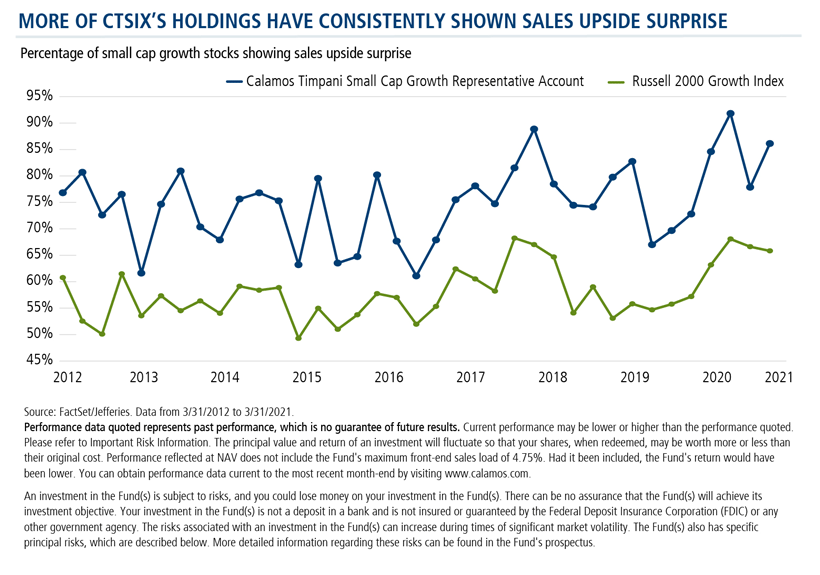
CTSIX active management. The CTSIX team has a history of success in focusing on companies with underestimated growth. According to data since 2012, 75% of the fund’s holdings have on average shown sales upside surprise (compared to 58% on average of the Russell 2000 Growth Index)—helping drive the fund’s long-term performance.
Midpoint Check-in
Halfway through 2021, Nelson is taking stock of the first six months and what lies ahead, offering the following notes about what may be less apparent about the fund.
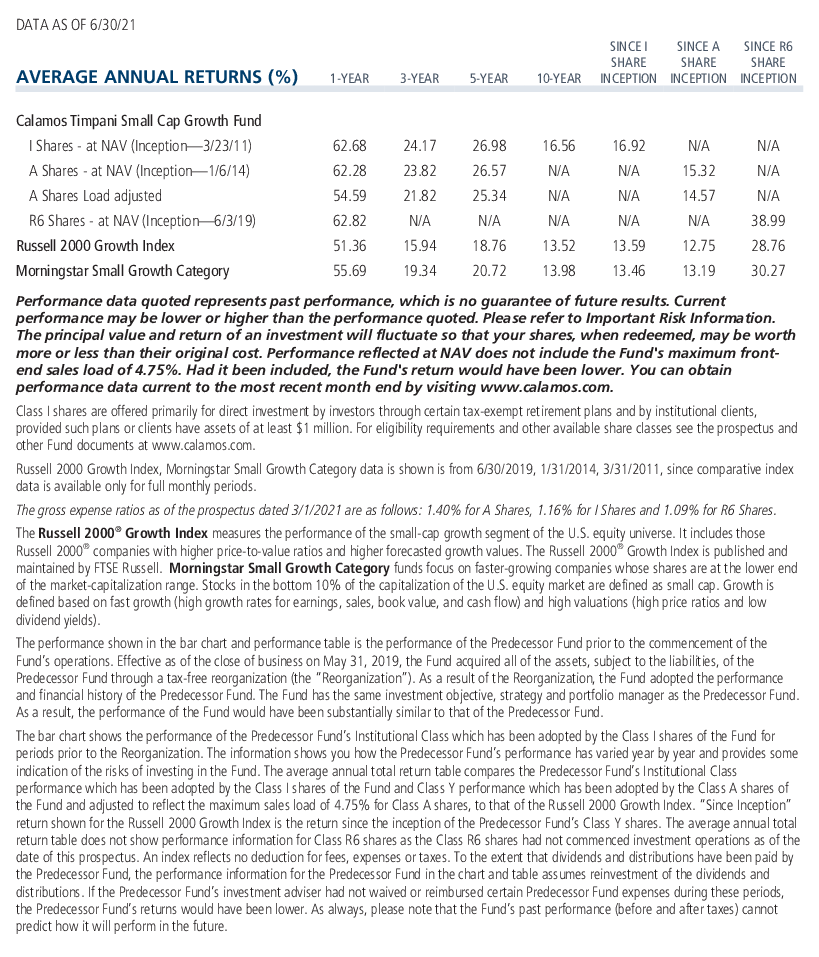
‘Growthy’ CTSIX’s resilience. Coming off its strong 2020—a year when CTSIX outperformed its benchmark by more than 2800 basis points—the small cap growth fund hit a rough patch in the spring.
“Small caps took their medicine,” Nelson says. “From 3/12/21 to 5/28/21, small caps gave back 26% of the relative gains from 9/8/20 to 3/11/21.” That’s to be expected, he says. “You should expect periodic pullbacks…it’s actually healthy as it likely creates sustainability to the move.”
During the period, small cap value trounced small cap growth, in particular.
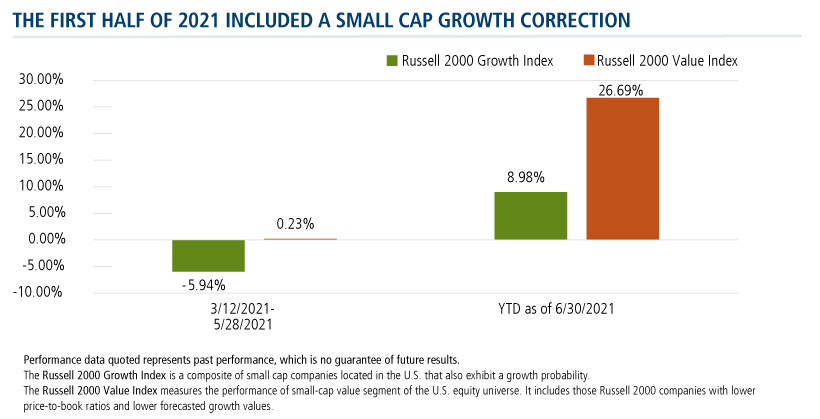
But here’s what may have been overlooked: “A storm came through town, and CTSIX did just fine,” Nelson says. And, in mid-June, he declared the small cap correction over.
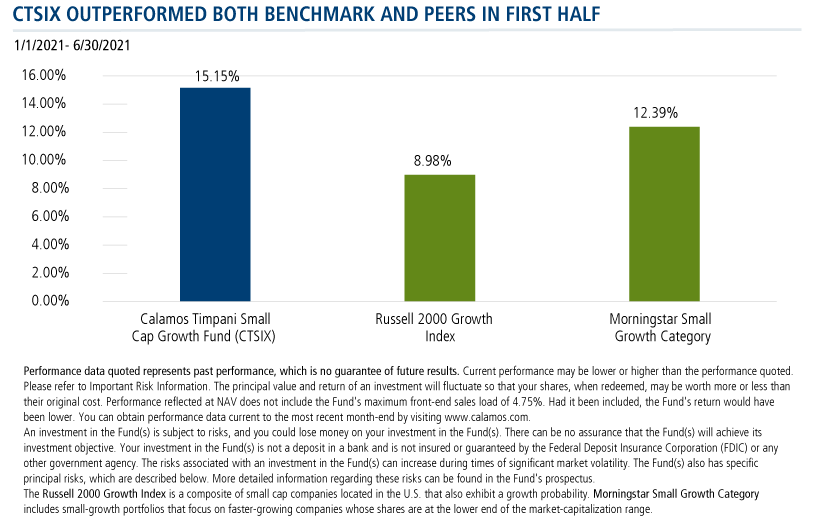
The fund’s YTD performance—up 15.15% versus the 8.98% return of the Russell 2000 Growth at 6/30—is a particular point of pride.
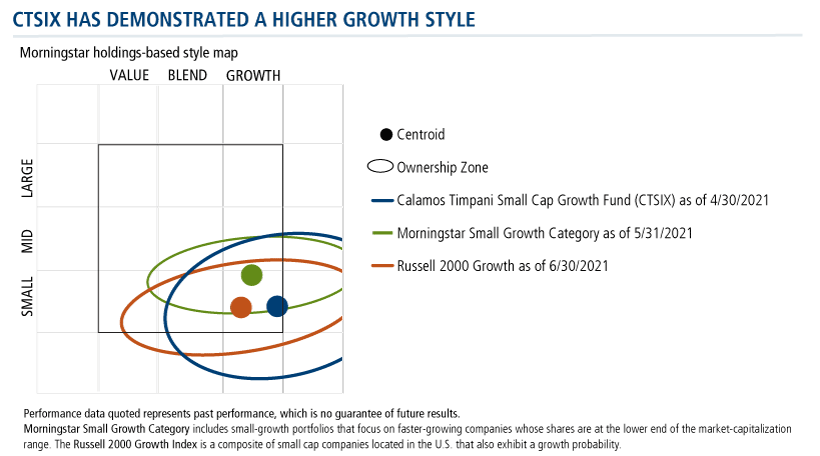
A fund that’s as “growthy” as CTSIX (see below) might have been expected to struggle in a rotation to value, not overperform, Nelson notes.
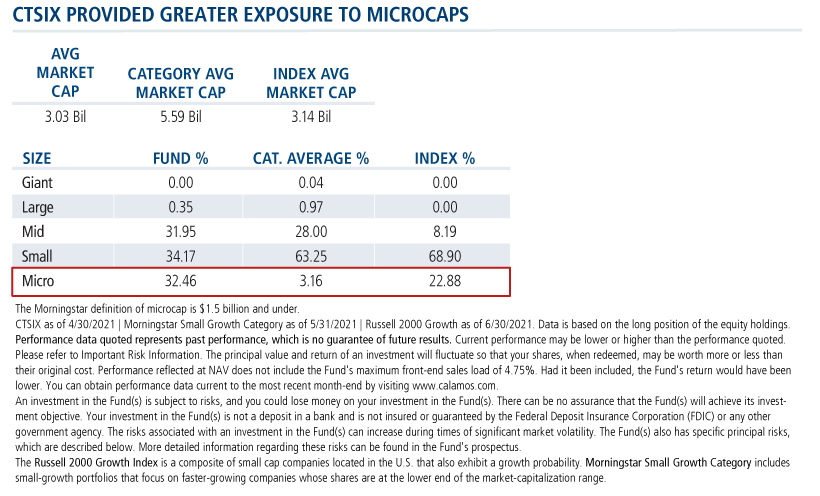
A microcap advantage. As Nelson anticipates an extended period of small cap dominance, he includes microcap outperformance in his forecast. CTSIX had a relatively low asset base at about $365 million by the end of June, giving it plenty of excess capacity to own microcaps. This is a competitive advantage.
“If small caps do win, I’d expect microcaps to win by more," Nelson says.
Further, he predicts, “What’s going to happen, and we saw this happen September through March, is that money pours into small cap ETFs, and this disproportionately helps microcap stocks. They’re sloppier traders, they’re underowned, and a lot of our peers can’t navigate there.”
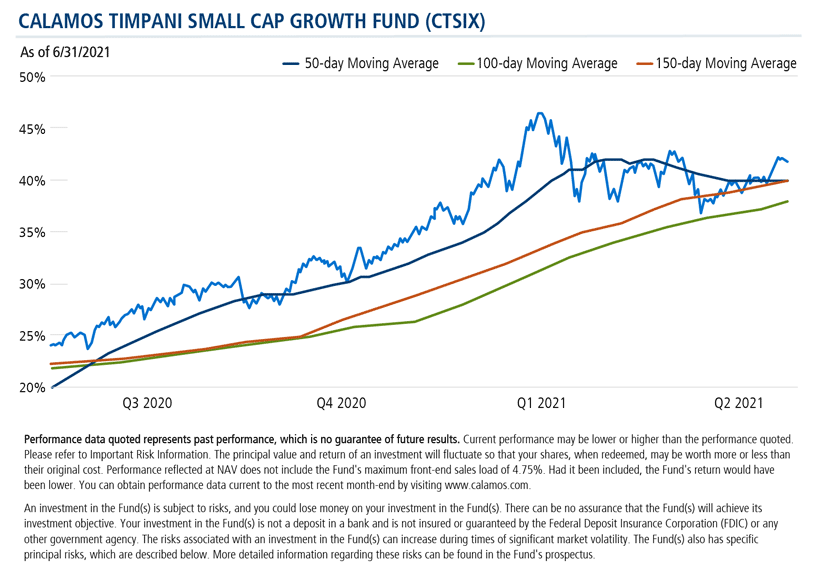
A technical perspective. As a final note, Nelson gets technical, showing this moving average chart of CTSIX as the “opinion of the marketplace.”
“This is similar to the charts we look at for the stocks in our portfolio. If this chart belonged to one of our holdings, I’d like it. The fund is sitting on support [the orange line 150-day average].
“It’s all just part of a mosaic,” Nelson continues, “but we really like where we are right now.”
Investment professionals, for more information about Nelson’s small cap outlook or CTSIX, contact your Calamos Investment Consultant at 888-571-2567 or caminfo@calamos.com.
Before investing, carefully consider the fund’s investment objectives, risks, charges and expenses. Please see the prospectus and summary prospectus containing this and other information which can be obtained by calling 1-866-363-9219. Read it carefully before investing.
Opinions and estimates offered constitute our judgment and are subject to change without notice, as are statements of financial market trends, which are based on current market conditions. We believe the information provided here is reliable, but do not warrant its accuracy or completeness. This material is not intended as an offer or solicitation for the purchase or sale of any financial instrument. The views and strategies described may not be suitable for all investors. This material has been prepared for informational purposes only, and is not intended to provide, and should not be relied on for, accounting, legal or tax advice. References to future returns are not promises or even estimates of actual returns a client portfolio may achieve. Any forecasts contained herein are for illustrative purposes only and are not to be relied upon as advice or interpreted as a recommendation. References to specific securities, asset classes and financial markets are for illustrative purposes only and are not intended to be, and should not be interpreted as, recommendations.
Opinions are subject to change due to changes in the market, economic conditions or changes in the legal and/or regulatory environment and may not necessarily come to pass. This information is provided for informational purposes only and should not be considered tax, legal, or investment advice. References to specific securities, asset classes and financial markets are for illustrative purposes only and are not intended to be, and should not be interpreted as, recommendations.
Important Risk Information. An investment in the Fund(s) is subject to risks, and you could lose money on your investment in the Fund(s). There can be no assurance that the Fund(s) will achieve its investment objective. Your investment in the Fund(s) is not a deposit in a bank and is not insured or guaranteed by the Federal Deposit Insurance Corporation (FDIC) or any other government agency. The risks associated with an investment in the Fund(s) can increase during times of significant market volatility. The Fund(s) also has specific principal risks, which are described below. More detailed information regarding these risks can be found in the Fund's prospectus.
The principal risks of investing in the Calamos Timpani Small Cap Growth Fund include: equity securities risk consisting of market prices declining in general, growth stock risk consisting of potential increased volatility due to securities trading at higher multiples, and portfolio selection risk. The Fund invests in small capitalization companies, which are often more volatile and less liquid than investments in larger companies. As a result of political or economic instability in foreign countries, there can be special risks associated with investing in foreign securities, including fluctuations in currency exchange rates, increased price volatility and difficulty obtaining information. In addition, emerging markets may present additional risk due to potential for greater economic and political instability in less developed countries.
The Morningstar Small Growth Category includes small-growth portfolios that focus on faster-growing companies whose shares are at the lower end of the market-capitalization range.
The Russell 2000 Index measures the performance of the 2,000 smallest companies in the Russell 3000 Index, which represents approximately 8% of the total market capitalization of the Russell 3000 Index.
The Russell 2000 Growth Index measures the performance of the small-cap growth segment of the U.S. equity universe. It includes those Russell 2000 companies with higher price-to-value ratios and higher forecasted growth values.
802444 721
Archived material may contain dated performance, risk and other information. Current performance may be lower or higher than the performance quoted in the archived material. For the most recent month-end fund performance information visit www.calamos.com. Archived material may contain dated opinions and estimates based on our judgment and are subject to change without notice, as are statements of financial market trends, which are based on current market conditions at the time of publishing. We believed the information provided here was reliable, but do not warrant its accuracy or completeness. This material is not intended as an offer or solicitation for the purchase or sale of any financial instrument. The views and strategies described may not be suitable for all investors. This material has been prepared for informational purposes only, and is not intended to provide, and should not be relied on for, accounting, legal or tax advice. References to future returns are not promises or even estimates of actual returns a client portfolio may achieve. Any forecasts contained herein are for illustrative purposes only and are not to be relied upon as advice or interpreted as a recommendation.
Performance data quoted represents past performance, which is no guarantee of future results. Current performance may be lower or higher than the performance quoted. The principal value and return of an investment will fluctuate so that your shares, when redeemed, may be worth more or less than their original cost. Performance reflected at NAV does not include the Fund’s maximum front-end sales load. Had it been included, the Fund’s return would have been lower.
Archived on July 13, 2022