Long/Short Equity Has Outperformed Long Equity Over the Long Term. Period.
November 6, 2019
When we introduce long/short equity to financial advisors, this is the chart that gets us pretty close to a “drop the mic” moment.
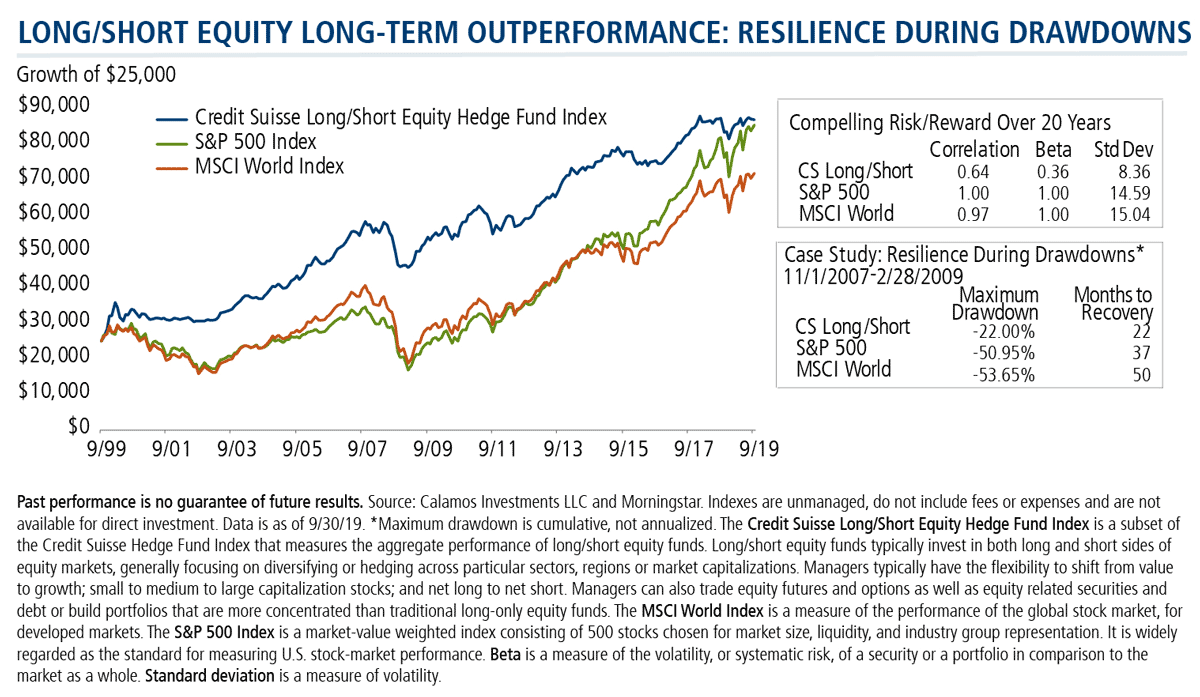
As you can see, long/short equity, as measured by the Credit Suisse Long/Short Equity Index, has outperformed the S&P 500 and the MSCI World Index over 20 years—with less volatility and lower drawdowns. Any questions?
Consideration of long/short equity is resonating especially now in this period of record high market valuations at a time of heightening geopolitical concerns, slowing economic dynamics, and a Federal Reserve that may be less accommodating to equity markets moving forward.
Financial advisors, to learn more, talk to a Calamos Investment Consultant at 888-571-2567 or email caminfo@calamos.com.
Alternative investments may not be suitable for all investors. Long/Short investing risks include the risk of equity securities market prices declining in general and short sale risk which has potential for unlimited losses.
The Credit Suisse Long/Short Equity Hedge Fund Index is a subset of the Credit Suisse Hedge Fund Index that measures the aggregate performance of long/short equity funds. Long/short equity funds typically invest in both long and short sides of equity markets, generally focusing on diversifying or hedging across particular sectors, regions or market capitalizations. Managers typically have the flexibility to shift from value to growth; small to medium to large capitalization stocks; and net long to net short. Managers can also trade equity futures and options as well as equity related securities and debt or build portfolios that are more concentrated than traditional long-only equity funds.
The MSCI World Index is a measure of the performance of the global stock market, for developed markets.
The S&P 500 Index is a market-value weighted index consisting of 500 stocks chosen for market size, liquidity, and industry group representation. It is widely regarded as the standard for measuring U.S. stock market performance.
801809 1119
Archived material may contain dated performance, risk and other information. Current performance may be lower or higher than the performance quoted in the archived material. For the most recent month-end fund performance information visit www.calamos.com. Archived material may contain dated opinions and estimates based on our judgment and are subject to change without notice, as are statements of financial market trends, which are based on current market conditions at the time of publishing. We believed the information provided here was reliable, but do not warrant its accuracy or completeness. This material is not intended as an offer or solicitation for the purchase or sale of any financial instrument. The views and strategies described may not be suitable for all investors. This material has been prepared for informational purposes only, and is not intended to provide, and should not be relied on for, accounting, legal or tax advice. References to future returns are not promises or even estimates of actual returns a client portfolio may achieve. Any forecasts contained herein are for illustrative purposes only and are not to be relied upon as advice or interpreted as a recommendation.
Performance data quoted represents past performance, which is no guarantee of future results. Current performance may be lower or higher than the performance quoted. The principal value and return of an investment will fluctuate so that your shares, when redeemed, may be worth more or less than their original cost. Performance reflected at NAV does not include the Fund’s maximum front-end sales load. Had it been included, the Fund’s return would have been lower.
Archived on November 05, 2020