While the intent of this year’s tax cuts and heightened government spending is to stimulate the U.S. economy, the changes also have the potential to wake up inflation—something market professionals are on the lookout for. And yet, as Matt Freund, Co-CIO and Head of Fixed-Income Strategies told The Wall Street Journal last week, “Inflation pressures have been more expected than realized.”
There was a nuance to Matt’s statement that is elaborated on in this post by Christian Brobst, Vice President, Portfolio Specialist.
Many people consider the Consumer Price Index (CPI) the authoritative measure of inflation. But we pay closer attention to two other indexes—which are currently sending conflicting signals that bear watching.
The Personal Consumption Expenditures Core Price Index (PCE) tracks overall price changes for goods and services purchased by consumers. This has been the Federal Reserve’s preferred measure since 2000. It’s a dynamic measure as its inputs literally change as consumption behavior changes. It includes a broader basket of goods and services than the more broadly followed CPI.
The Underlying Inflation Gauge (UIG) was introduced by the Federal Reserve Bank of New York in 1995 as a means of capturing sustained movements in a broad set of prices, while incorporating additional macroeconomic and financial variables. Tracking these variables provides insight into inflationary pressures.
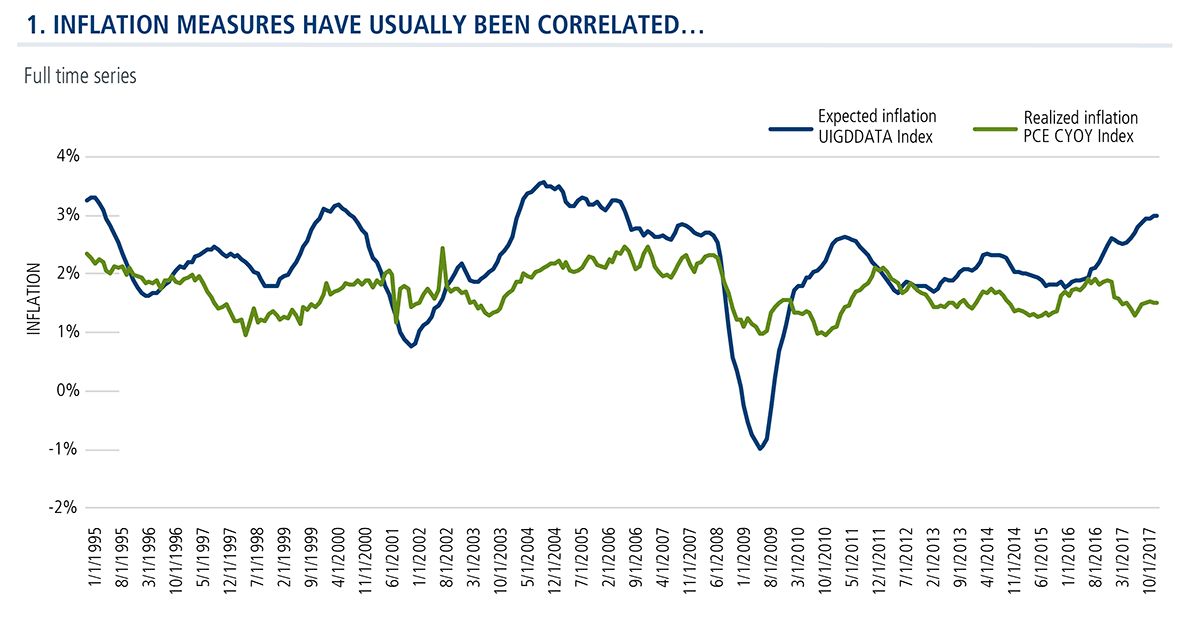
Chart 1 below shows a clear correlation between the two measures, despite the UIG exhibiting more volatility. In its 23-year history, the UIG has provided statistically significant predictive value for PCE inflation.

In other words, UIG can be viewed as a measure of expected trend inflation while PCE is a measure of realized inflation. Generally, directional changes in UIG are realized in PCE.
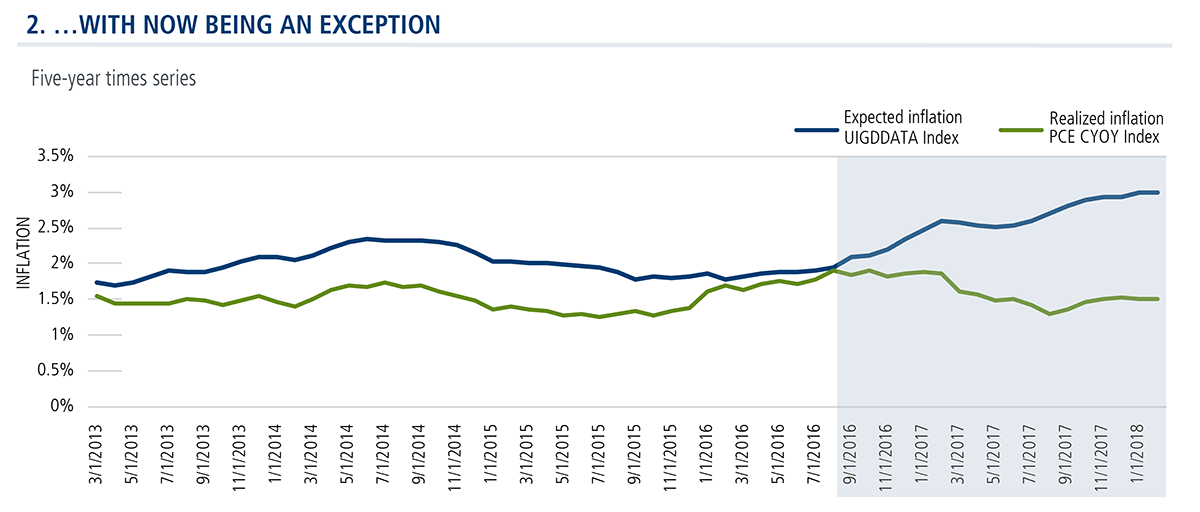
However, note that Chart 2 below—which isolates the performance of the indexes over the last five years—shows a clear divergence between the two. Starting in August 2016, they have continued to grow apart to the extent that expected inflation and realized inflation are now in very different ranges.

This divergence is not unique, nor is the magnitude. Similar gaps between UIG and PCE were observed in 2004 and again in 2010. What’s perplexing, to the Fed and market participants alike, is how long the divergence has persisted (currently since August 2016). In previous periods of divergence, it has been typical to see the trend reversing within a year.
At least two scenarios could explain persistent low inflation despite continued improvement in employment and growth statistics:
- In periods of rising inflation, UIG expectations have a tendency to overshoot what realized inflation is according to PCE.
- Or, there’s something more fundamental underway. Possible explanations include the disinflationary pressure of advancing technology and the changing demographics of our country and the world. Aging populations tend to consume less, thus reducing demand for consumer goods lowering inflation (present-day Japan is a good example of this). Advances in technology can make goods cheaper to consumers through increased competition for consumer dollars (e.g., online shopping).
Perhaps a combination of the two have led to a more persistent fundamental breakdown of the longer term relationship between UIG and PCE.
Today’s persistent lack of PCE inflation despite mounting inflationary pressure is remarkable. The UIG appears to be driven by stronger fundamental growth than the actual inflation data PCE is capturing.
Advisors, if you’re looking for new ideas in this environment, your Calamos Investment Consultant can help. Contact him or her at 888-571-2567 or caminfo@calamos.com.

