How Long Could Emerging Markets Lead? See These 2 Charts
February 24, 2021
- When’s it going to start?
- Are we there yet?
- Is it almost over?
Millions of words have been written in service of encouraging investors to be patient, to understand market cycles, to acknowledge market dynamics.
But there’s no overcoming human nature. Investors can be quite fidgety at all times. When conditions are worrisome, investors can become convinced that things will remain worrisome indefinitely. And yet when things are positive, there’s a tendency to worry that it can’t last.
It’s in this spirit that we present two charts for your consideration in evaluating emerging markets exposure for your clients.
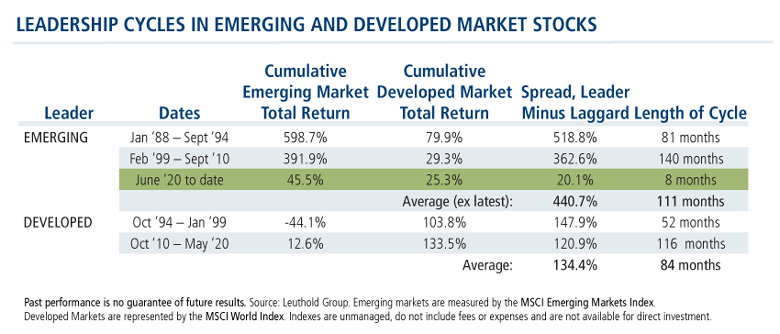
1. Developed vs. Emerging Markets Outperformance Cycles Have Lasted For Years
-
This table suggests not just that emerging markets have taken the lead over developed markets, but that this cycle could persist for a while. As shown, 111 months is the average length of a cycle when emerging market stocks have outperformed developed markets. This February 2021 chart shows that we are eight months in, with leadership reversing in June of last year.
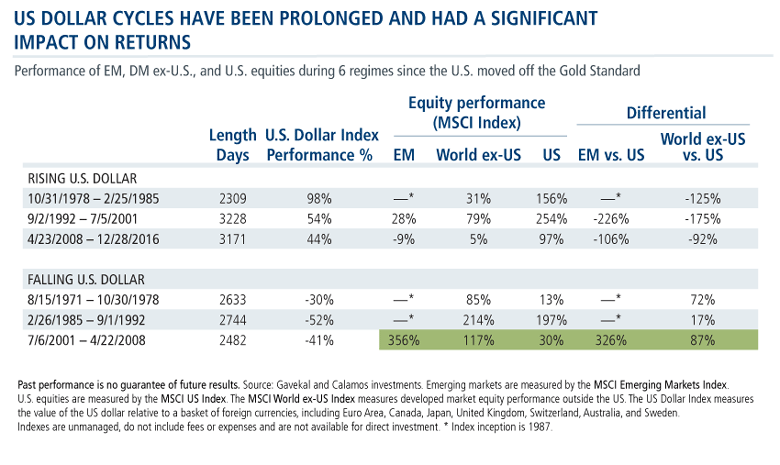
2. Weak Dollar Cycles Have Persisted, to Emerging Markets’ Advantage
-
When it comes to emerging markets, the U.S. dollar has had a significant effect on returns. With this data, too, there are two points to make:
- Dollar cycles can be prolonged.
- Look at how non-U.S. markets have outperformed during weaker dollar regimes.
This table considers the six regimes since the U.S. moved off the gold standard in the 1970s. The MSCI Emerging Markets Index, specifically, has been in existence for only one complete weaker dollar regime, the seven-year period between July 2001 and April 2008. Emerging markets stocks gained 356% in that cycle. Compare that to the U.S. seven-year return of 30% and the good but-not-as-great 117% return of the MSCI World ex-US Index.
Of course, investors are correct to be skeptical: No cycle lasts indefinitely and past performance is no guarantee of what happens next. But the experienced portfolio management team of Calamos Evolving World Growth Fund (CNWIX) likes emerging markets prospects—especially when actively managed—for the foreseeable future.
Register for our March 10 webcast to hear the team’s thoughts on the secular growth themes and thematic tailwinds driving the EM opportunity. Presenting will be Calamos Founder, Chairman and Global Chief Investment Officer John P. Calamos, Sr., Nick Niziolek, CFA, Co-CIO, Head of International and Global Strategies and Senior Co-Portfolio Manager, and Todd Speed, CFA, Senior Vice President, Portfolio Specialist.
Or, investment professionals, if you’d like to talk to your Calamos Investment Consultant sooner, reach out at 888-571-2567 or caminfo@calamos.com.
Before investing, carefully consider the fund’s investment objectives, risks, charges and expenses. Please see the prospectus and summary prospectus containing this and other information which can be obtained by calling 1-866-363-9219. Read it carefully before investing.
An investment in the Fund(s) is subject to risks, and you could lose money on your investment in the Fund(s). There can be no assurance that the Fund(s) will achieve its investment objective. Your investment in the Fund(s) is not a deposit in a bank and is not insured or guaranteed by the Federal Deposit Insurance Corporation (FDIC) or any other government agency. The risks associated with an investment in the Fund(s) can increase during times of significant market volatility. The Fund(s) also has specific principal risks, which are described below. More detailed information regarding these risks can be found in the Fund’s prospectus.
The principal risks of investing in the Calamos Evolving World Growth Fund include: the risk the equity market will decline in general, the risks associated with growth securities which tend to trade at higher multiples and be more volatile, the risks associated with foreign securities including currency exchange rate risk, the risks associated with emerging markets which may have less stable governments and greater sensitivity to economic conditions, and the risks associated with convertible securities, which may decline in value during periods of rising interest rates.
Convertible Securities Risk: The value of a convertible security is influenced by changes in interest rates, with investment value declining as interest rates increase and increasing as interest rates decline. The credit standing of the issuer and other factors also, may have an effect on the convertible security’s investment value.
As a result of political or economic instability in foreign countries, there can be special risks associated with investing in foreign securities, including fluctuations in currency exchange rates, increased price volatility and difficulty obtaining information. In addition, emerging markets may present additional risk due to potential for greater economic and political instability in less developed countries. Total return assumes reinvestment of dividends and capital gains distributions and reflects the deduction of any sales charges, where applicable. Performance may reflect the waiver of a portion of the Fund’s advisory or administrative fees for certain periods since the inception date. If fees had not been waived, performance would have been less favorable.
The MSCI World ex USA Index captures large and mid cap representation across 22 of 23 Developed Markets (DM) countries*—excluding the United States. With 962 constituents, the index covers approximately 85% of the free float-adjusted market capitalization in each country.
The MSCI Emerging Markets Index is a free float-adjusted market capitalization index that is designed to measure equity market performance of emerging markets. The index is calculated on a total return basis, which includes reinvestment of gross dividends before deduction of withholding taxes.
802316 221
Archived material may contain dated performance, risk and other information. Current performance may be lower or higher than the performance quoted in the archived material. For the most recent month-end fund performance information visit www.calamos.com. Archived material may contain dated opinions and estimates based on our judgment and are subject to change without notice, as are statements of financial market trends, which are based on current market conditions at the time of publishing. We believed the information provided here was reliable, but do not warrant its accuracy or completeness. This material is not intended as an offer or solicitation for the purchase or sale of any financial instrument. The views and strategies described may not be suitable for all investors. This material has been prepared for informational purposes only, and is not intended to provide, and should not be relied on for, accounting, legal or tax advice. References to future returns are not promises or even estimates of actual returns a client portfolio may achieve. Any forecasts contained herein are for illustrative purposes only and are not to be relied upon as advice or interpreted as a recommendation.
Performance data quoted represents past performance, which is no guarantee of future results. Current performance may be lower or higher than the performance quoted. The principal value and return of an investment will fluctuate so that your shares, when redeemed, may be worth more or less than their original cost. Performance reflected at NAV does not include the Fund’s maximum front-end sales load. Had it been included, the Fund’s return would have been lower.
Archived on February 24, 2022