History’s Fastest Snapback Altered the Timing, But Equity Rebalancing Still Makes Sense
August 19, 2020
And, we are just about right back where we started.
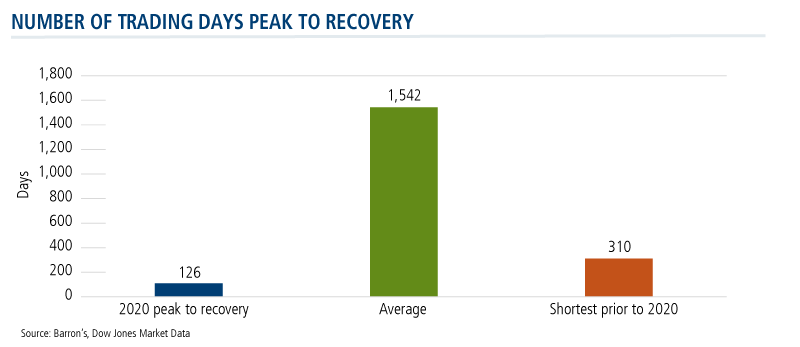
The market’s recovery in 126 trading days from bear market levels is the fastest on record—an outcome that few could have predicted when the market was plunging from February to March.
Prior to February 19, of course, many marveled at the 11-year duration of the bull market while at the same time expressing concern about investors’ vulnerability to a reversal. Count this blog among them as on January 16 we suggested “Here’s One Way to Rebalance—Before the Market Does It for You.”
Our thesis: That the market would eventually fall and those overexposed to equities would suffer declines that could be mitigated with a hedging strategy.
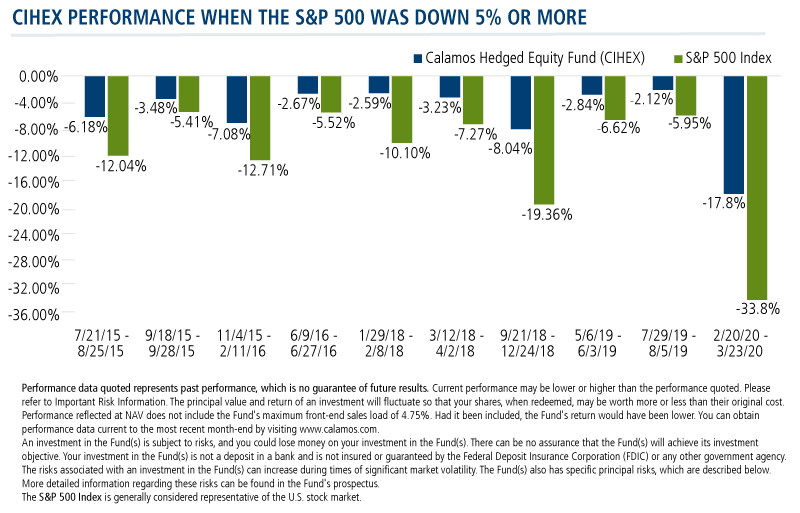
In fact, when the market drew down, Calamos Hedged Equity Fund (CIHEX) performed as advertised: It took part in about half the S&P 34% drawdown and outperformed its peers by more than 400 basis points (see this post).
While our post made no predictions, the underlying assumption was that the market could remain under pressure for a while. A typical peak-to-peak recovery takes 1,542 trading days, on average, according to Dow Jones Market Data quoted in Barron’s last week. Until this year, the shortest recovery was 310 trading days.
The Evolution of a 60/40 Portfolio
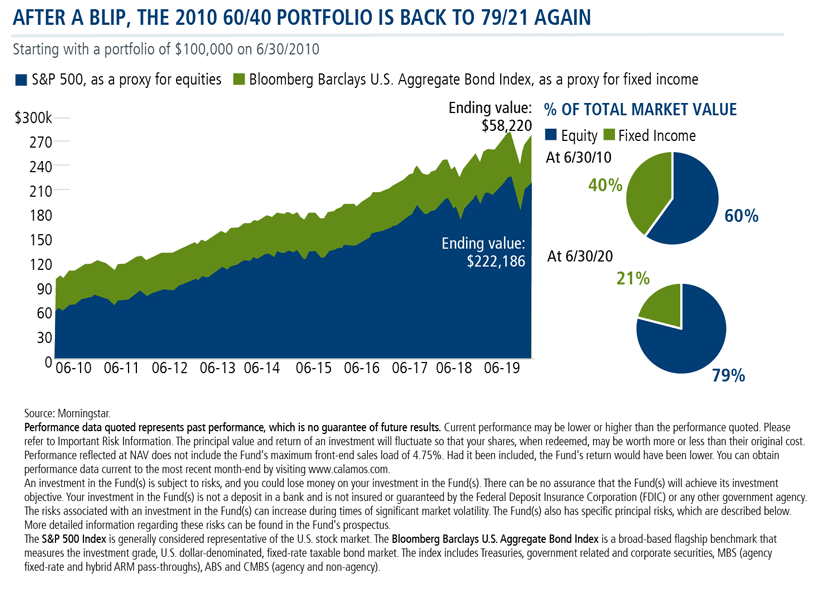
The duration of the drawdown matters when you look at a legacy 60/40 portfolio, as we did in January. An investment of $100,000 into a 60/40 portfolio 10 years prior (December 31, 2009) would have appreciated to $271,774 by December 31 of 2019. Most of that growth would have come from appreciation of the equity allocation. However, in January 2020 that 60/40 portfolio had grown into 79% equities and 21% fixed income—representing substantially more risk.
The premise of January’s message was that a ferocious bear market could materialize and destroy some of that added equity value. A prolonged bear market could shake that 79/21 back down to 60/40, a consequence that could be avoided by a plan to rebalance away from so much equity risk.
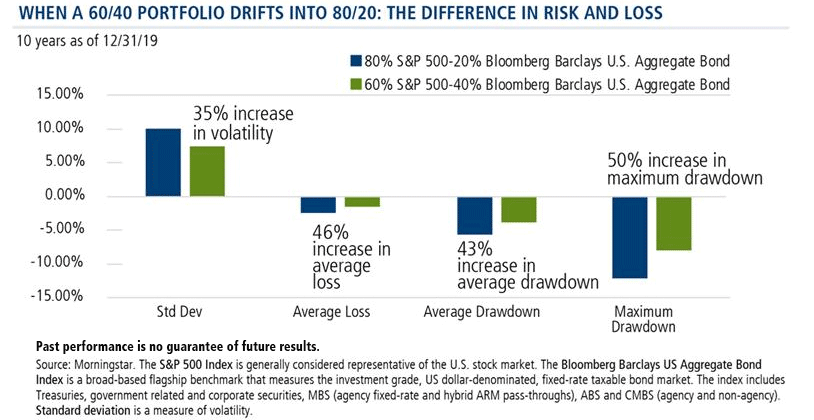
The risk/return profile of a 60/40 portfolio is very different than a portfolio approaching 80/20. Below is an example of these differences in an 80/20 equity/fixed income portfolio relative to a 60/40 portfolio over the trailing 10 years (models rebalanced annually). With an 80/20 portfolio, a client is subject to a 35% increase in volatility and a 46% increase in potential loss to the portfolio, we showed in January.
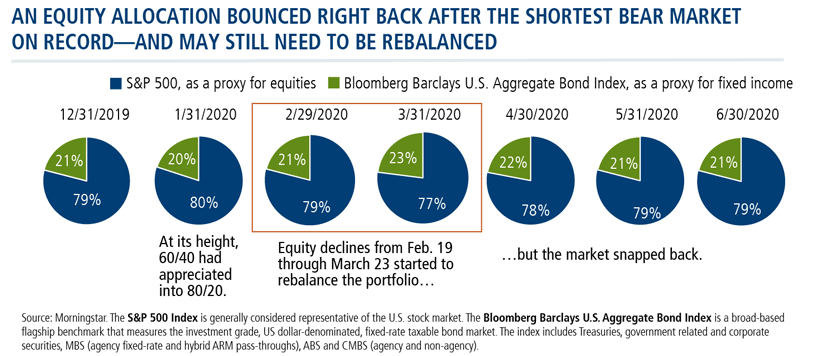
Sure enough, things did start to head that way this spring. But here’s the curveball thrown by the historically fast snapback. After a momentary blip when equity losses resulted in a shift to a 77/23 mix by the end of March, equities reversed track and the model portfolio has bounced back to 79/21 or back where the year started.
A 'Bullish' Way to Rebalance: CIHEX
So here we are, again making no predictions but noting the risk inherent in not rebalancing.
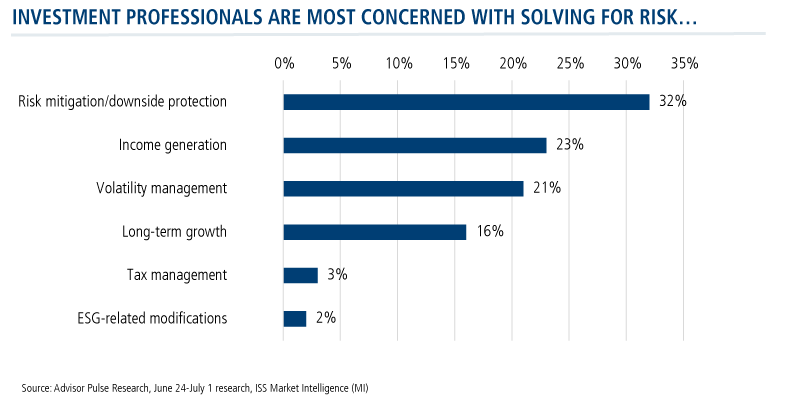
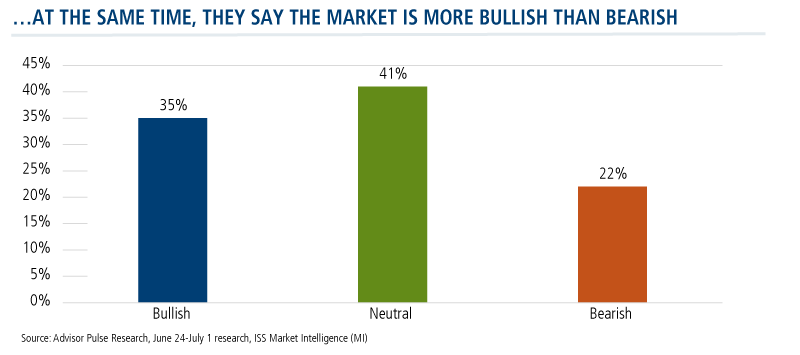
What may be different now is that the COVID-19 market crisis has challenged what sometimes appeared to be previous complacency of investment professionals. Research conducted in July by ISS MI Market Intelligence reported two noteworthy insights:
- That more advisors believe that the market is bullish rather than bearish
- That they are most concerned with solving for risk mitigation and “downside protection”
If you believe, as the Calamos Investment Committee does (see commentary), that significant market volatility will continue as the market trends upward, consider how CIHEX can help. Consider CIHEX as a “bullish” way to rebalance: It can help you keep client assets in an equity strategy while reducing their equity beta, allowing for both upside equity potential and risk mitigation, without moving assets into fixed income.
CIHEX has proven its ability to de-risk without trading away all of the upside. Below see how CIHEX has worked over the 10 equity down markets (S&P 500) since its inception in December 2014.
Investment professionals, for more information about CIHEX, contact your Calamos Investment Consultant at 888-571-2567 or caminfo@calamos.com.
Before investing, carefully consider the fund’s investment objectives, risks, charges and expenses. Please see the prospectus and summary prospectus containing this and other information which can be obtained by calling 1-866-363-9219. Read it carefully before investing.
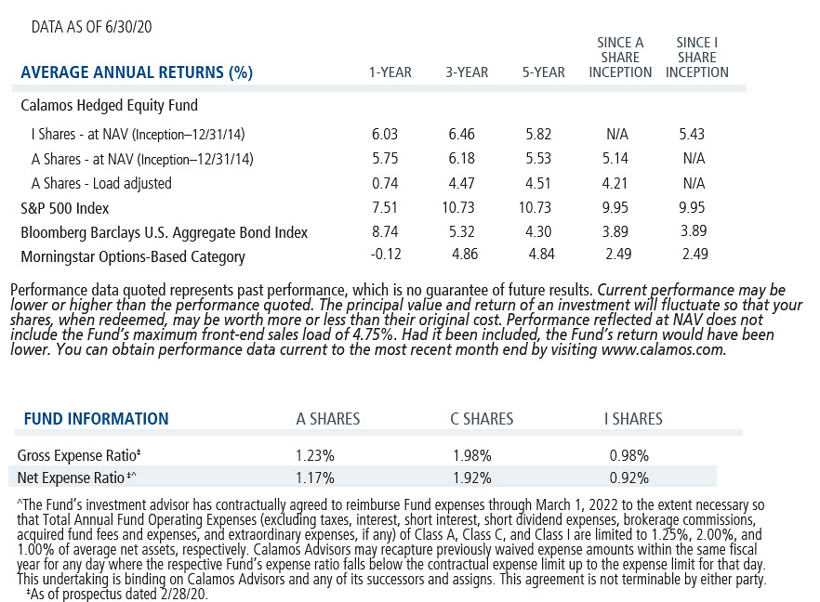
Performance data quoted represents past performance, which is no guarantee of future results. Current performance may be lower or higher than the performance quoted. Please refer to Important Risk Information. The principal value and return of an investment will fluctuate so that your shares, when redeemed, may be worth more or less than their original cost. Performance reflected at NAV does not include the Fund's maximum front-end sales load of 4.75%. Had it been included, the Fund's return would have been lower. You can obtain performance data current to the most recent month-end by visiting www.calamos.com.
An investment in the Fund(s) is subject to risks, and you could lose money on your investment in the Fund(s). There can be no assurance that the Fund(s) will achieve its investment objective. Your investment in the Fund(s) is not a deposit in a bank and is not insured or guaranteed by the Federal Deposit Insurance Corporation (FDIC) or any other government agency. The risks associated with an investment in the Fund(s) can increase during times of significant market volatility. The Fund(s) also has specific principal risks, which are described below. More detailed information regarding these risks can be found in the Fund's prospectus.
The principal risks of investing the Calamos Hedged Equity Fund include: covered call writing risk, options risk (see definition below), equity securities risk, correlation risk, mid-sized company risk, interest rate risk, credit risk, liquidity risk, portfolio turnover risk, portfolio selection risk, foreign securities risk, American depository receipts, and REITs risks.
The S&P 500 Index is generally considered representative of the U.S. stock market.
The Bloomberg Barclays US Aggregate Bond Index is a broad-based flagship benchmark that measures the investment grade, US dollar-denominated, fixed-rate taxable bond market. The index includes Treasuries, government related and corporate securities, MBS (agency fixed-rate and hybrid ARM pass-throughs), ABS and CMBS (agency and non-agency).
Morningstar Options-Based Category funds may use a variety of strategies, including but not limited to: put writing, covered call writing, option spread, options-based hedged equity, and collar strategies. In addition, options-based funds may seek to generate a portion of their returns, either indirectly or directly, from the volatility risk premium associated with options trading strategies.
Morningstar Ratings™ are based on risk-adjusted returns and are through [As Of 7/31/20] for Class I shares and will differ for other share classes. Morningstar ratings are based on a risk-adjusted return measure that accounts for variation in a fund’s monthly historical performance (reflecting sales charges), placing more emphasis on downward variations and rewarding consistent performance. Within each asset class, the top 10%, the next 22.5%, 35%, 22.5%, and the bottom 10% receive 5, 4, 3, 2 or 1 star, respectively. Each fund is rated exclusively against U.S. domiciled funds. The information contained herein is proprietary to Morningstar and/or its content providers; may not be copied or distributed; and is not warranted to be accurate, complete or timely. Neither Morningstar nor its content providers are responsible for any damages or losses arising from any use of this information. Source: ©2020 Morningstar, Inc.
802112 0820
Archived material may contain dated performance, risk and other information. Current performance may be lower or higher than the performance quoted in the archived material. For the most recent month-end fund performance information visit www.calamos.com. Archived material may contain dated opinions and estimates based on our judgment and are subject to change without notice, as are statements of financial market trends, which are based on current market conditions at the time of publishing. We believed the information provided here was reliable, but do not warrant its accuracy or completeness. This material is not intended as an offer or solicitation for the purchase or sale of any financial instrument. The views and strategies described may not be suitable for all investors. This material has been prepared for informational purposes only, and is not intended to provide, and should not be relied on for, accounting, legal or tax advice. References to future returns are not promises or even estimates of actual returns a client portfolio may achieve. Any forecasts contained herein are for illustrative purposes only and are not to be relied upon as advice or interpreted as a recommendation.
Performance data quoted represents past performance, which is no guarantee of future results. Current performance may be lower or higher than the performance quoted. The principal value and return of an investment will fluctuate so that your shares, when redeemed, may be worth more or less than their original cost. Performance reflected at NAV does not include the Fund’s maximum front-end sales load. Had it been included, the Fund’s return would have been lower.
Archived on August 19, 2021