Equity Revival or Economic Slowdown: CPLIX’s Michael Grant Weighs In on the Debate
April 17, 2019
Is the stock market correct in its optimism that monetary normalization is over and equities have more runway in 2019?
Or, is the more correct view what’s being expressed today by the credit market—that the global economy is slowing down, with the slowdown serving as a prelude to recession?
Calamos Co-CIO Michael Grant leans toward the latter, which he elaborated on in a recent meeting with financial advisors.
“Our conclusion is that the wait-and-see neutrality by the Fed will not restore the bull market of risk assets, and that the unusual longevity of this expansion has created vulnerability in key areas of the economy,” said Grant, Head of Global Long/Short Strategies and Sr. Co-Portfolio Manager of Calamos Phineus Long/Short Fund (CPLIX).
CPLIX, positioned to seek both preservation of capital and gains, is at the lowest net market exposure (+4% at 3/31/19) than it’s been for years. Grant's goal is to produce a market return by assuming only a fraction of the overall market risk and exposure.
Underlying Grant’s analysis is his perspective that capital subsidization has had a (monetary) opioid-like effect on equity investing. Like with opioids, Grant said, “If you stick with subsidization too long, it starts to distort. It creates malaise, it depresses productivity, and it ultimately reduces long-term growth.” (For more, see Grant’s Reclaiming the Investor Psyche: A Roadmap [PDF]).
The Fed’s efforts to stop artificially suppressing interest rates and return to normal became so challenged last year that financial conditions became nearly as tight as they were in 2007 and 2008. Fed Chairman Jerome Powell’s subsequent “capitulation” to further rate increases was well received by the markets, leading to a quarter-long relief rally.
However, Grant said, while the Fed may have stepped back, the risk of economic slowdown still looms.
Optimism vs. The Data
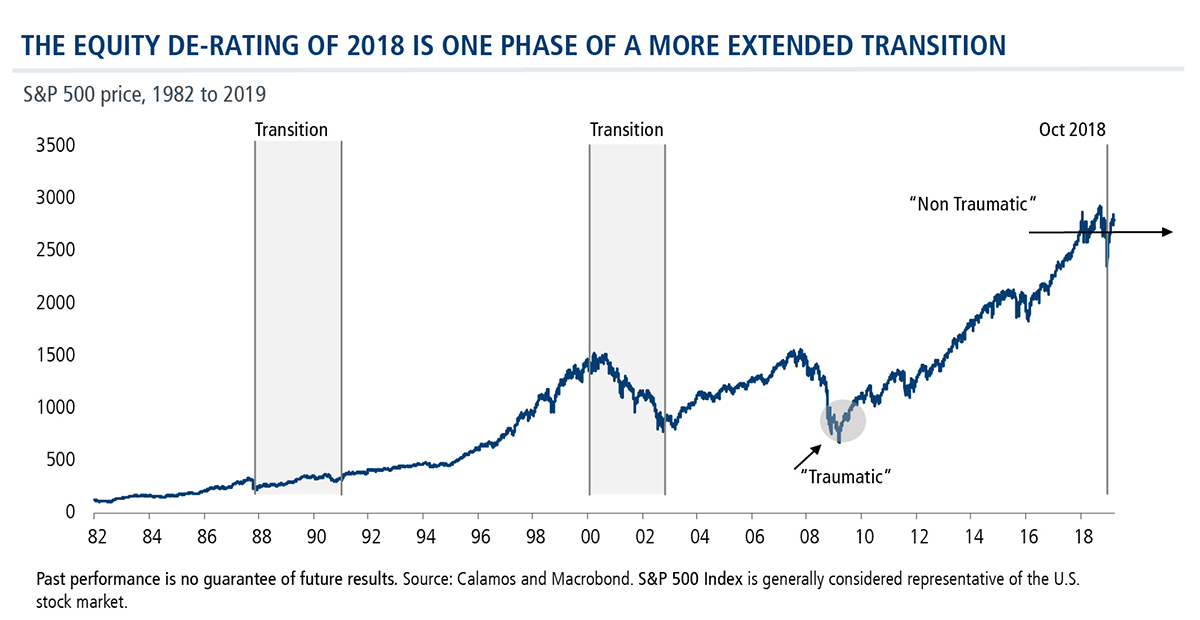
The bull market itself ended in October, Grant believes, describing the current period as a transition in equity markets as “investors slowly begin to understand the new logic of economic growth and financial asset pricing without Fed-sponsored interest rate subsidization." Unlike in 2008, this transition is likely to be non-traumatic, he said.
Equity investors cheered by the market so far this year might prefer to think of December as a bad dream. But they would be in denial, according to Grant. There’s no avoiding the data below showing the graying, but not necessarily expiration, of the earnings cycle. Activity, sales and margins in all major markets have declined.
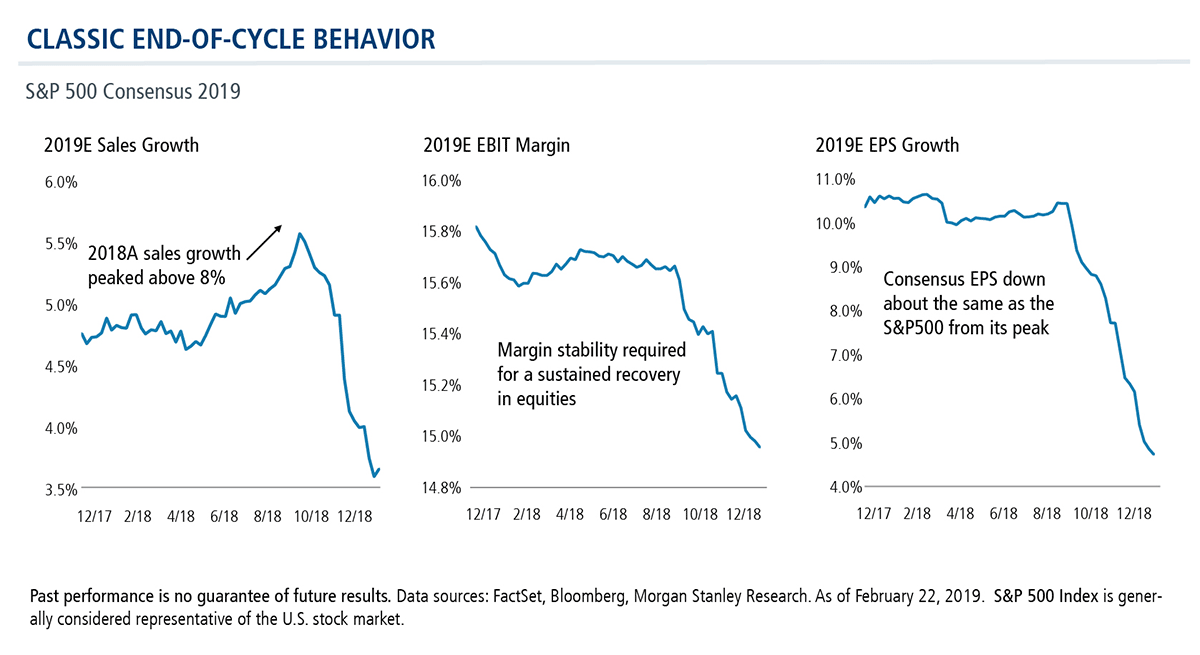
Revenue growth for the S&P 500 peaked above 8% in 2018, and expectations are now less than 4%. The pullback is dramatic and across the board—the worst estimates revisions in any post-2008 period, according to Grant.

Last year’s tax reform created a kind of boom/bust cycle for corporations, said Grant. Spending was extended to meet cyclically strong demand—companies boosted their cost structures, including admin, depreciation and debt service.
Now, said Grant, “we’re out of ways for the corporate sector to grow without impacting margins.” Slowing sales and weaker profits may lead to cost-cutting to protect profitability.
“Much of the problem is that [President Donald] Trump enacted tax reform not when he should have done it but when he could do it,” said Grant. “He should have done it right now, at this point in the earnings cycle.”
Earnings peaked in the third quarter of 2018, and led to the modest Q1 2019 earnings decline. But has earnings momentum bottomed? Not according to the optimism expressed in the market, Grant said.
“The consensus in the equity world is now expecting earnings growth to re-accelerate from here. In other words, they’re expecting firms to adjust their business models for the remainder of this year.”
At Best, A Capped Upside
Grant suspects such expectations are premature. He expects an earnings decline of 5%-10% in the second half of the year, which would be a broader earnings recession than what was experienced in 2015-2016. In that period, he said, the S&P earnings deceleration lasted eight quarters peak to trough.
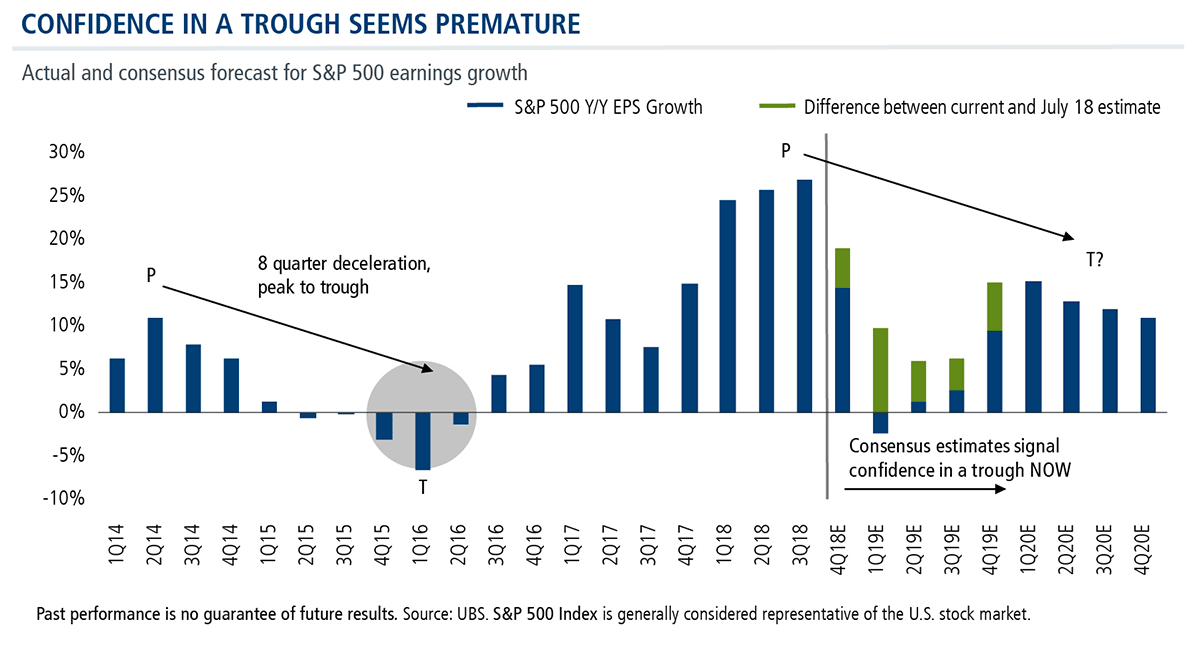
“How reasonable is it that we get just a two-quarter deceleration peak to trough now?” he asked.
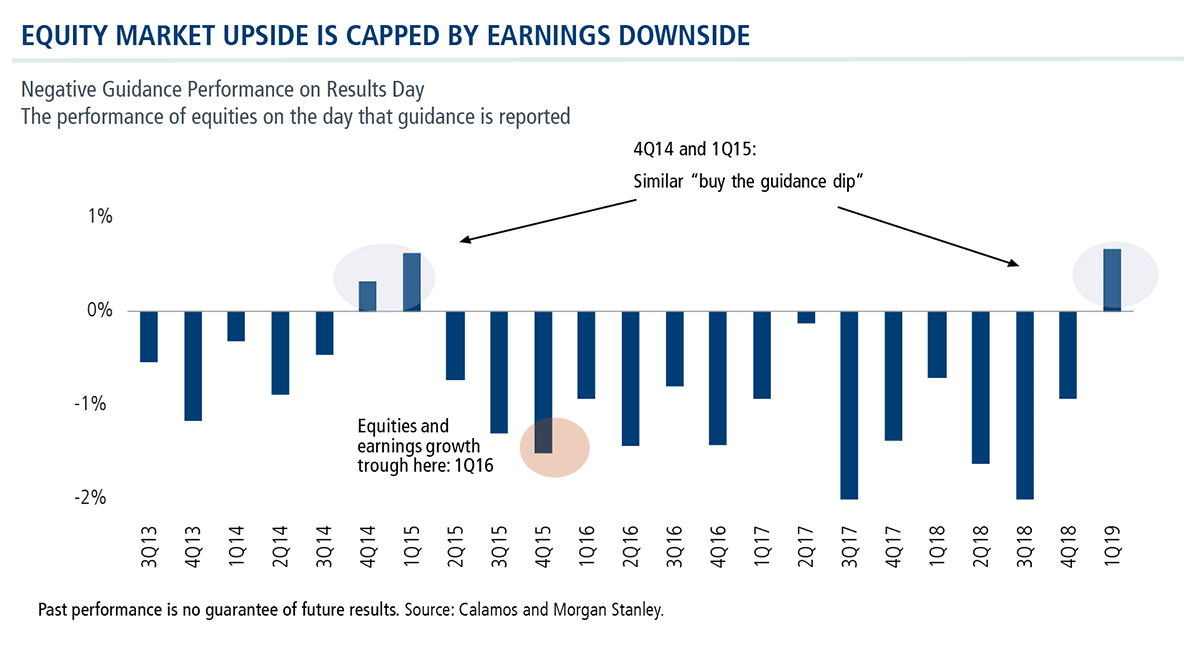
And yet confidence in the trough is apparent in investor behavior in the first quarter. Ordinarily, upward earnings guidance revisions lead equities to rise, downward revisions lead equities to decline. But the first quarter saw the opposite occur: Investors rewarded lower first quarter earnings guidance with positive stock performance. They were likely encouraged by the Fed signaling a halt to interest rate increases as well as expectations for a truce in the U.S./China trade disputes.
Such “buying the dip” behavior is relatively rare, and last happened in the fourth quarter of 2014 and first quarter of 2015. At that time, investors were 12 months early—the market trough didn’t occur until the first quarter of 2016.
Grant believes the upside for equity investors today is capped at best.
The Bond Market’s Perspective
Taking the other side of the debate are bond investors, who Grant described as less sanguine about the near future. As long as corporate profit growth weakens through 2019, the corporate credit cycle cannot improve.
The good news in credit: there’s been very little excessive growth in households and the banking system. In part, that’s why “when we do have issues, they’ll be non-traumatic in nature,” he said.
It’s the corporate debt market—which has more than doubled in size, from $3 trillion to $7.5 trillion—where Grant believes the economy’s vulnerabilities lie.
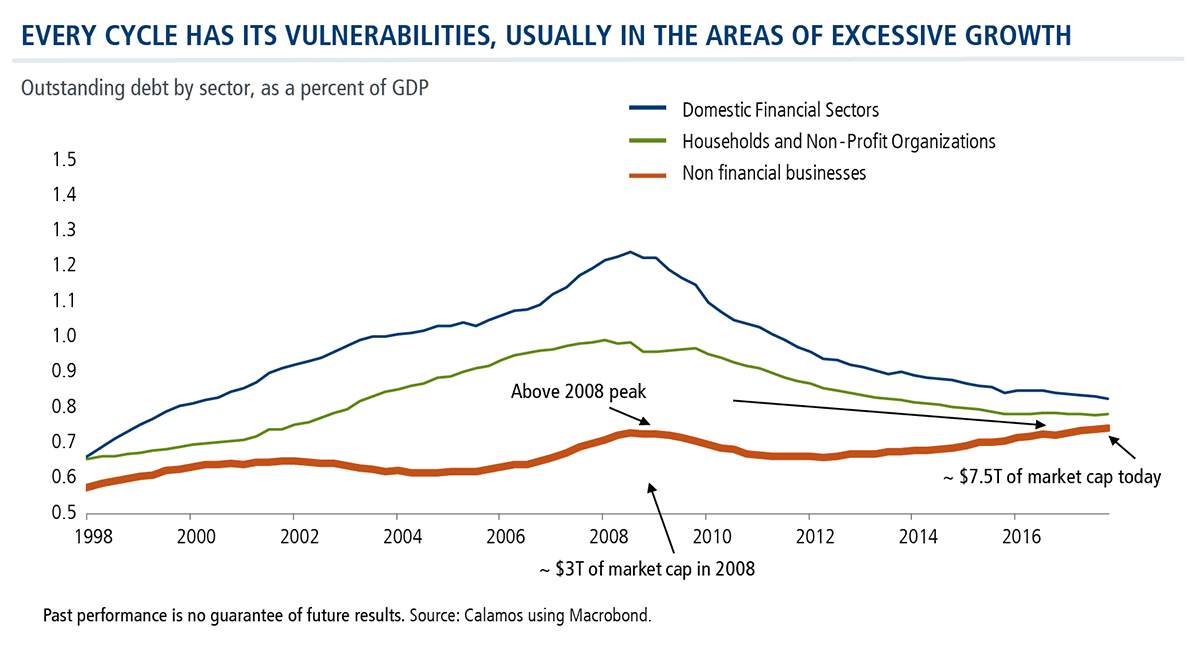
If there is an earnings recession, Grant said, a “pillaging of corporate balance sheets” will be the source of vulnerability. “The last time [corporate debt] rose like this, in ’08, it was because we were heading into a dramatic slowdown. We’re already beginning to see this kind of rise before we’ve even hit the slowdown.”
For much of the period since 2008, corporations were able to add debt without increasing their interest expense—an opportunity that has now closed, he added.
“Once the yield curve goes flat, extending leverage no longer makes sense as the carry trade is done, and the question is, does it actually trigger the beginning of a deleveraging?”
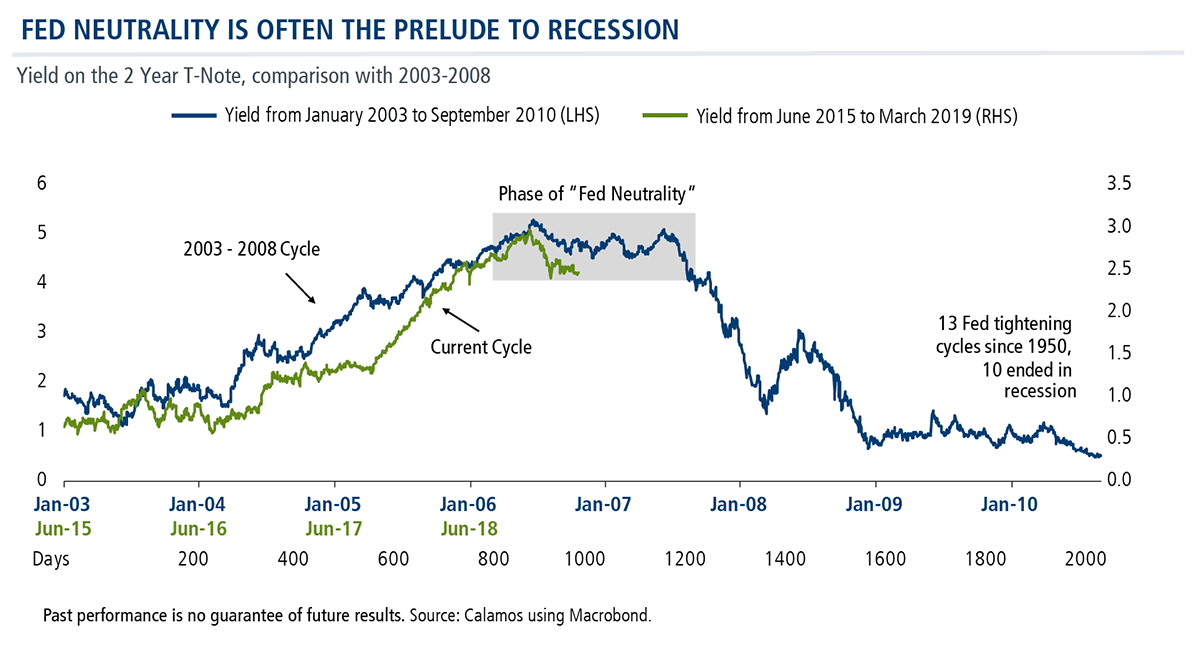
Grant acknowledged the historic challenge of the Fed trying to maintain neutrality. “In 10 of the last 13 tightening cycles,” he said, “we ended in recession. And, in those cycles that we didn’t, in ’94 or maybe ’98, it was partly because the Fed turned around and reduced rates quite aggressively.”
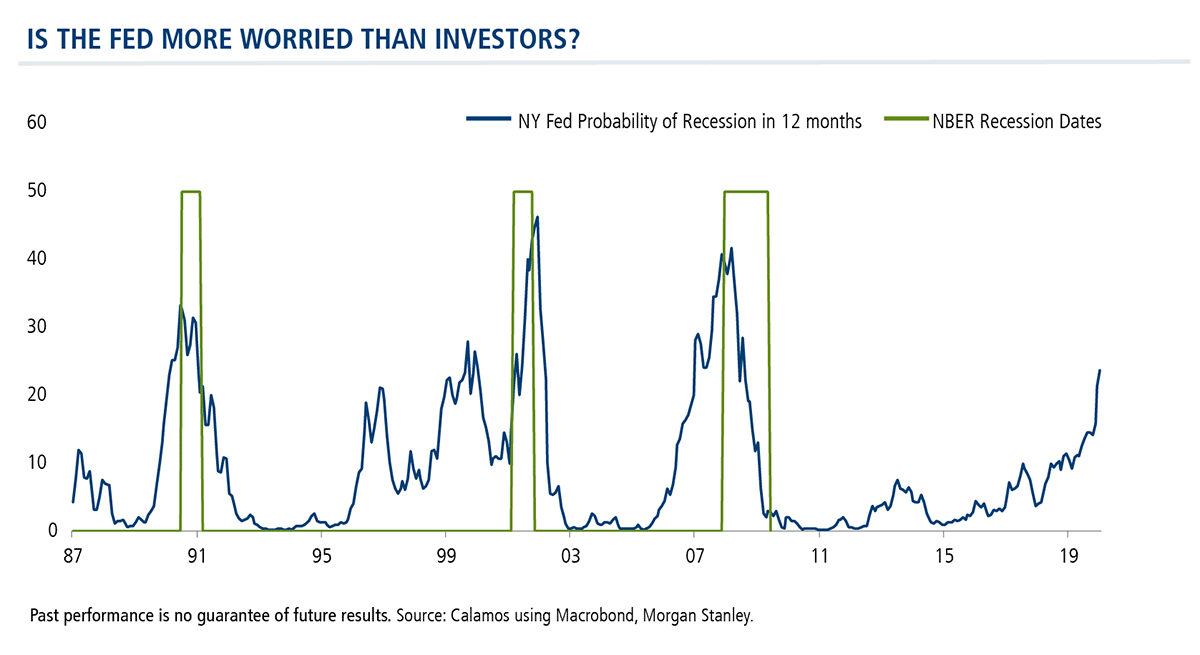
In fact, the Fed—which most relies on different measures of the yield curve—may be more worried about recession than investors, Grant said.
In summary, Grant expects the “non-traumatic” transition to continue through 2020. But, he believes, financial asset inflation is over, having set a top end of the equities trading range at 18.5 times earnings in January of 2018. He marks the bottom—what he calls the “Powell fear threshold” as established at the end of 2018—at 14 times earnings.
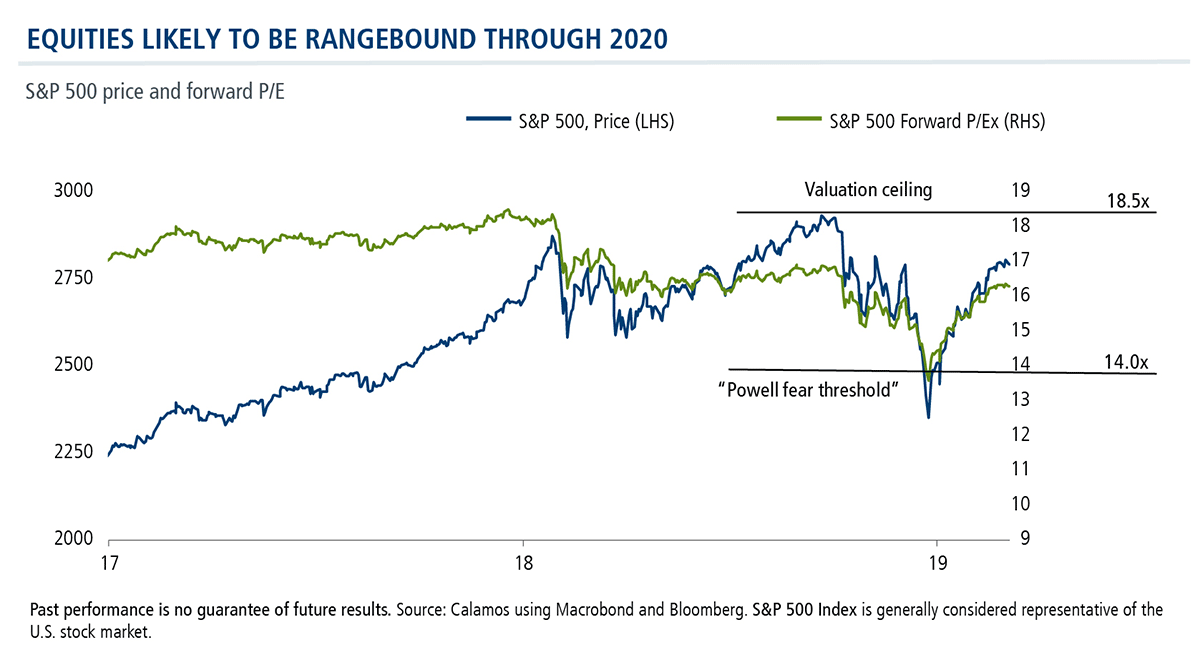
If the equity optimists are correct and break above this range, Grant would expect pressure on interest rates to return, and financial assets to deflate. If debt markets are correct, he said, equities are mispriced.
The legacy of 2018, Grant said, is an economy that’s much more cautious and defensive. The market can’t truly bottom until an earnings trough is established in the second half of this year and/or the Fed cuts rates aggressively in the third quarter, he said. Grant leaves room for the possibility that there’s another low in 2020, depending on “how the recession vulnerabilities play out.”
Advisors, talk to your Calamos Investment Consultant to get more information on Grant’s positioning and how CPLIX has outpaced the S&P 500 since its inception in 2002. Call 888-571-2567 or email caminfo@calamos.com.
Calamos was #1 in flows to funds in the Morningstar Alternatives Category in 2018, and ranks fourth on the list of alternative fund managers by assets under management as of 3/31/19.
Click here to view CPLIX's standardized performance.
Before investing, carefully consider the fund’s investment objectives, risks, charges and expenses. Please see the prospectus and summary prospectus containing this and other information which can be obtained by calling 1-866-363-9219. Read it carefully before investing.
Important Risk Information. An investment in the Fund(s) is subject to risks, and you could lose money on your investment in the Fund(s). There can be no assurance that the Fund(s) will achieve its investment objective. Your investment in the Fund(s) is not a deposit in a bank and is not insured or guaranteed by the Federal Deposit Insurance Corporation (FDIC) or any other government agency. The risks associated with an investment in the Fund(s) can increase during times of significant market volatility. The Fund(s) also has specific principal risks, which are described below. More detailed information regarding these risks can be found in the Fund's prospectus.
The principal risks of investing in Calamos Phineus Long/Short Fund include: equity securities risk consisting of market prices declining in general, short sale risk consisting of potential for unlimited losses, foreign securities risk, currency risk, geographic concentration risk, other investment companies (including ETFs) risk, derivatives risk, options risk, and leverage risk.
Alternative investments are not suitable for all investors.
S&P 500 Index is generally considered representative of the U.S. stock market.
The MSCI World Index is a market capitalization weighted index composed of companies representative of the market structure of developed market countries in North America, Europe and the Asia/Pacific region.
Morningstar Long/Short Equity Category funds take a net long stock position, meaning the total market risk from the long positions is not completely offset by the market risk of the short positions. Total return, therefore, is a combination of the return from market exposure (beta) plus any value-added from stock-picking or market-timing (alpha).
©2019 Calamos Investments LLC. All Rights Reserved. Calamos® and Calamos Investments® are registered trademarks of Calamos Investments LLC.
801548 419
Archived material may contain dated performance, risk and other information. Current performance may be lower or higher than the performance quoted in the archived material. For the most recent month-end performance information, please CLICK HERE. Archived material may contain dated opinions and estimates based on our judgment and are subject to change without notice, as are statements of financial market trends, which are based on current market conditions at the time of publishing. We believed the information provided here was reliable, but do not warrant its accuracy or completeness. This material is not intended as an offer or solicitation for the purchase or sale of any financial instrument. The views and strategies described may not be suitable for all investors. This material has been prepared for informational purposes only, and is not intended to provide, and should not be relied on for, accounting, legal or tax advice. References to future returns are not promises or even estimates of actual returns a client portfolio may achieve. Any forecasts contained herein are for illustrative purposes only and are not to be relied upon as advice or interpreted as a recommendation.
Performance data quoted represents past performance, which is no guarantee of future results. Current performance may be lower or higher than the performance quoted. The principal value and return of an investment will fluctuate so that your shares, when redeemed, may be worth more or less than their original cost. Performance reflected at NAV does not include the Fund’s maximum front-end sales load. Had it been included, the Fund’s return would have been lower. For the most recent month-end fund performance information visit www.calamos.com.
Archived material may contain dated performance, risk and other information. Current performance may be lower or higher than the performance quoted in the archived material. For the most recent month-end fund performance information visit www.calamos.com. Archived material may contain dated opinions and estimates based on our judgment and are subject to change without notice, as are statements of financial market trends, which are based on current market conditions at the time of publishing. We believed the information provided here was reliable, but do not warrant its accuracy or completeness. This material is not intended as an offer or solicitation for the purchase or sale of any financial instrument. The views and strategies described may not be suitable for all investors. This material has been prepared for informational purposes only, and is not intended to provide, and should not be relied on for, accounting, legal or tax advice. References to future returns are not promises or even estimates of actual returns a client portfolio may achieve. Any forecasts contained herein are for illustrative purposes only and are not to be relied upon as advice or interpreted as a recommendation.
Performance data quoted represents past performance, which is no guarantee of future results. Current performance may be lower or higher than the performance quoted. The principal value and return of an investment will fluctuate so that your shares, when redeemed, may be worth more or less than their original cost. Performance reflected at NAV does not include the Fund’s maximum front-end sales load. Had it been included, the Fund’s return would have been lower.
Archived on April 16, 2020