CPLIX’s Defensive Positioning Anticipates Economic Vulnerabilities, Market Schizophrenia
August 6, 2019
Michael Grant, Senior Co-Portfolio Manager of Calamos Phineus Long/Short Fund (CPLIX), will tell you that he finds himself in an unusual situation.
“For most of this fund’s history, we were structurally bullish. For the five years after the ‘08 crisis, we were structurally bullish when everyone was structurally bearish. This is a bit of an unusual situation for me to be not bullish. And,” adds Grant, Calamos Co-CIO and head of Global Long/Short Strategies, “it’s not always comfortable because this is a bullish business.”
With essentially 0 beta and 0 exposure in a year when the S&P 500 is up 20% through July 31, the positioning of CPLIX may continue to be defensive for the foreseeable future as the market comes to terms with economies in transition, according to Grant.
With negligible exposure to markets, the returns of 6.34% YTD through July 31 have been mostly attributed to alpha. “If we can achieve low-double digit returns this year, without subjecting our clients to the inherent risks associated with current market dynamics by maintaining relatively new neutral exposure levels, we will have achieved our goal.”
The bull market driving equities since 2008 is over and he’s determined to avoid the risks of “overstaying” the post-2008 trade. “End-cycle markets can be schizophrenic and erratic, with extreme differentials of valuation,” he says.
With market valuations at or above all-time highs, and the S&P 500 where it is, current and anticipated market dynamics suggest vulnerability at current levels.
Grant elaborated on his perspective at a recent meeting of investment professionals, continuing themes covered in previous posts (see Equity Revival or Economic Slowdown: CPLIX’s Michael Grant Weighs in on the Debate).
Rate Cut Notwithstanding, the Economy Is Reacting to the Effects of Fed Tightening
Last December, the worst since the 1930s, was followed by the best first quarter in 40 years. Such a V-shaped bottom is rare in 100 years of equity history, according to Grant. The return of what he calls the “QE Forever” trade “allows the optimistic to assume that the global slowdown has been discounted. That everything goes up in value despite low confidence and low volumes of activity.”
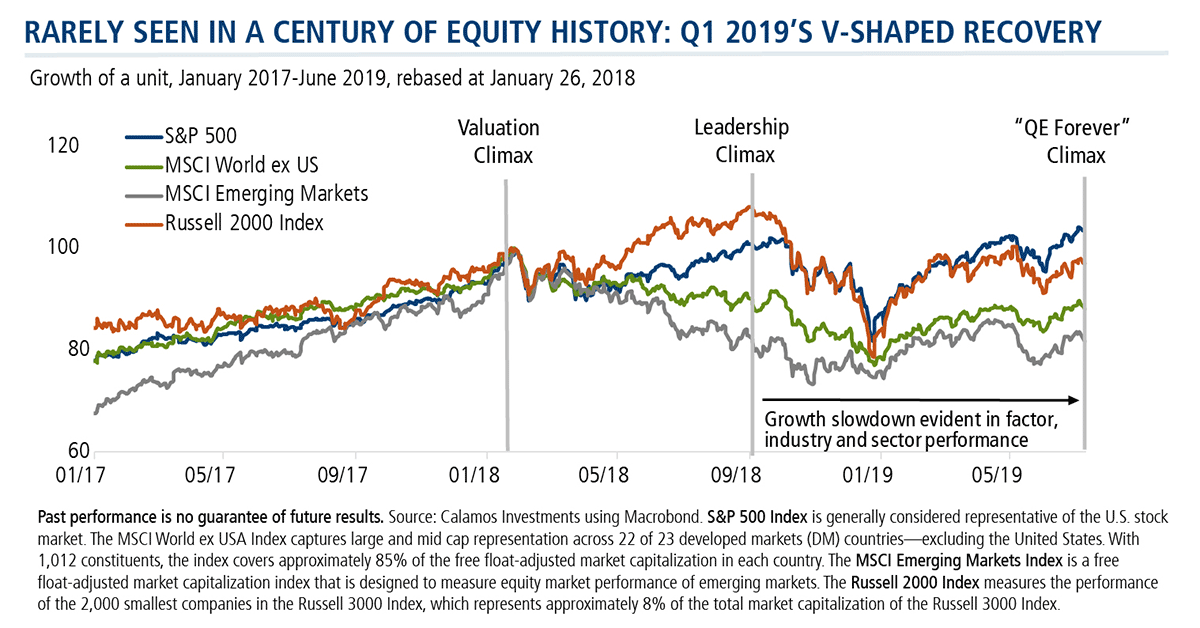
Last year shouldn’t have ended the way it did, the S&P’s gain year to date is not sustainable, and it can’t be trusted, he says.
“In 2018, markets should have been up single digits. Earnings were up 15%. To have a market where you get that much P/E compression is very unusual. Typically, the market would have been up 5% instead of down 6%. I think that flip of performance of 10 points out of last year’s return and into this year’s return has created a bit of a mirage.”
Grant says the market’s recovery has enabled investors to take a benign view when, in fact, there are economic vulnerabilities to be reckoned with. He says investors “obsessed” with the Fed cutting rates and trade policy uncertainty tend to overlook a larger consideration: that the U.S. economy is still digesting the impact of the Fed tightening cycle, which ended in December 2018. (The fact that the economy is reacting to the tightening even as the Fed has just now taken an “aggressive U-turn” and eased 25 basis points will make the equities correction a much more complex and probably extended period of consolidation, according to Grant.)
The U.S. economy is still robust. In the first quarter of this year, GDP grew 3.2%, one of the best growth rates in 10 years. But, as shown below, the economy tends to look healthiest at the end of a tightening cycle.
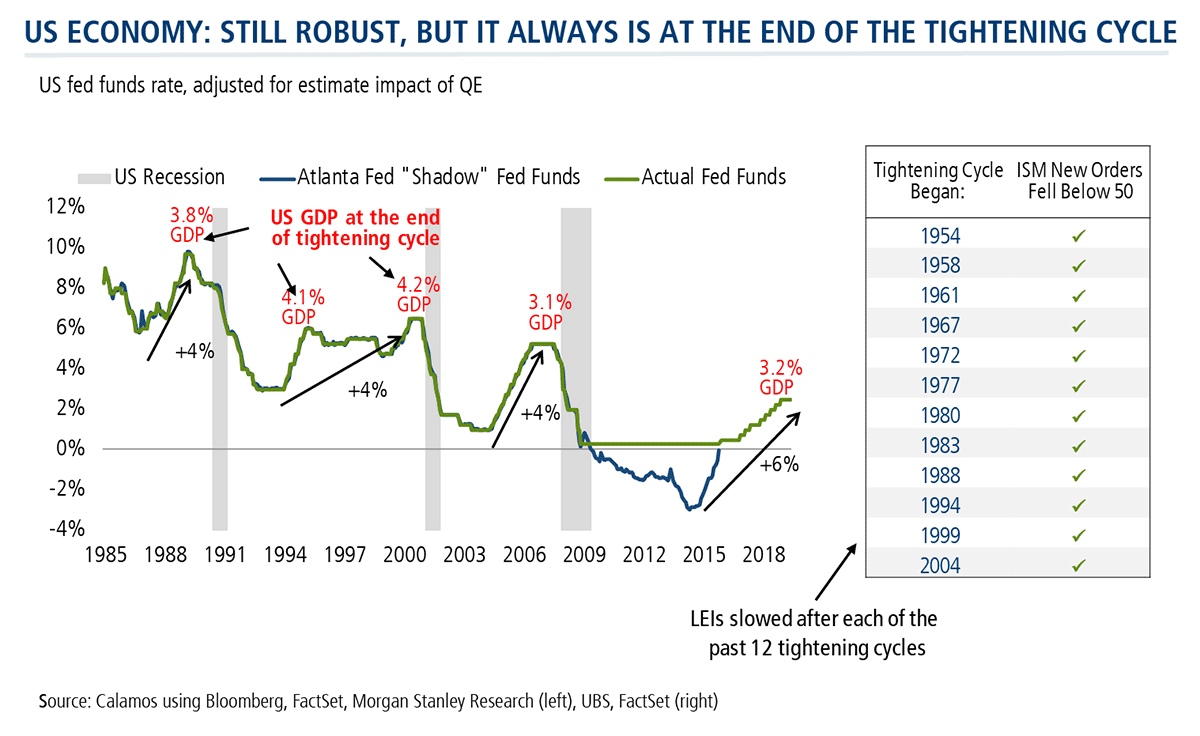
In every tightening cycle—in 12 of the 12 most recent—the economy slowed enough to push leading economic indicators (LEIs) into contraction. And, that’s what Grant sees ahead for the current economy.
The chart below tracks the ISM New Orders Index but, Grant says, leading economic indicators are correlated—“if you can figure out where one leading indicator is going, you can figure out where the others are going.”
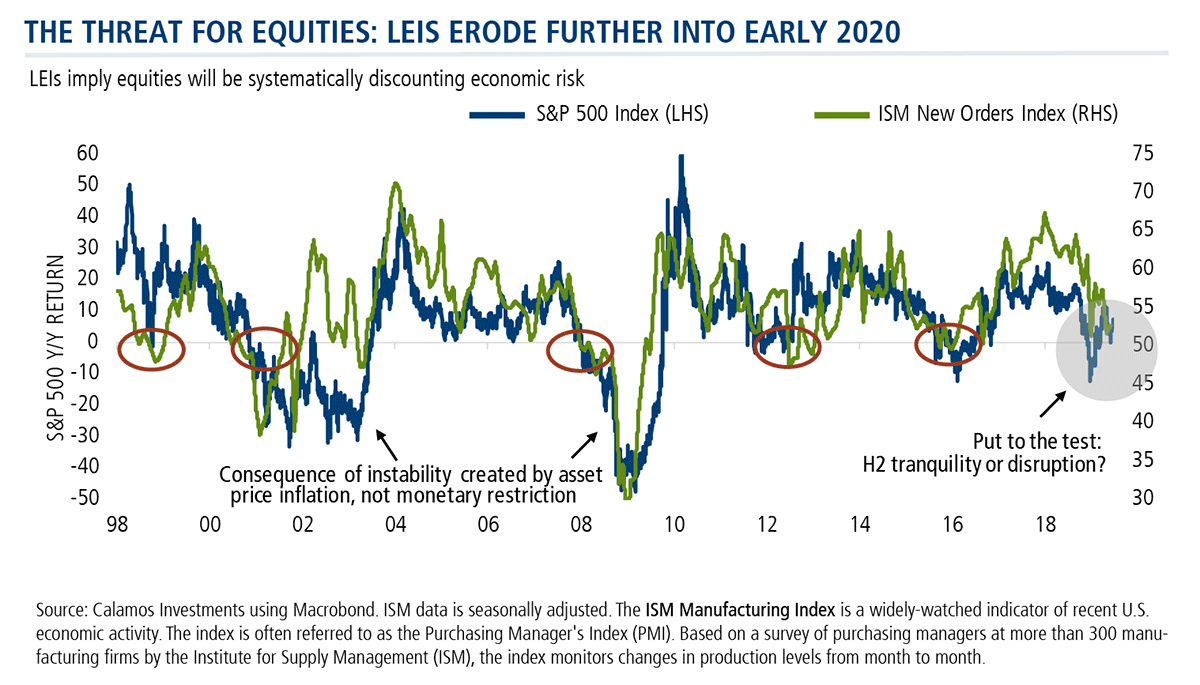
“Most indicators of economic risk for the remainder of this year suggest there’s more on the downside than the upside. When those leading indicators, which are basically barometers of the economics and the fundamentals, shift into contractionary mode, it tends to be a game-changer for markets.”
Earnings Recession Ahead
Grant likes this graph which uses the past nine business cycles beginning in 1974 to plot the performance of LEIs and the number of episodes when the S&P is up. The U.S. this year has been in the Stability stage.
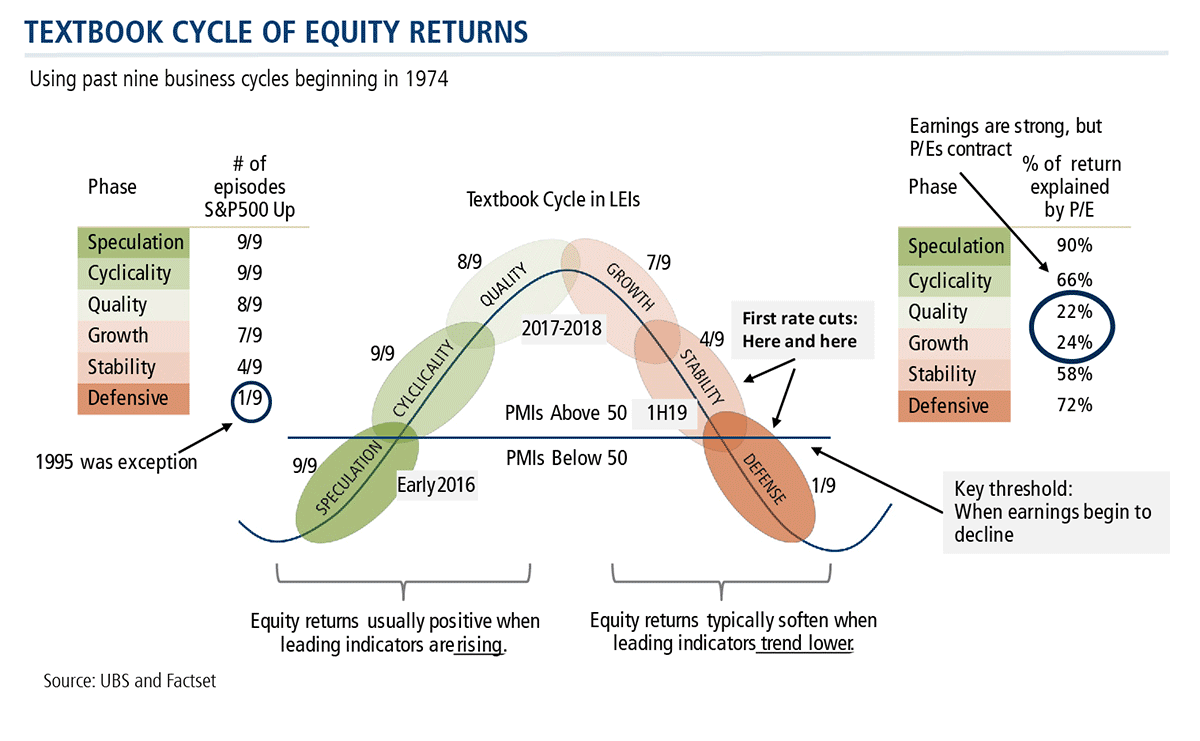
The key threshold is 0 because that’s when earnings go from positive or flat to negative. “Our business, as you know, is very earnings-centric, and a change in earnings tends to trigger a key psychological shift in how investors are looking at the risks,” Grant says.
Today’s backdrop is different from prior “mid-cycle” slowdowns, such as those in 2016 or 1995. Enthusiasm for Fed cuts is understandable, he says, but earnings estimates are too high. Investors need to anticipate a trough within six to nine months. Grant looks for a broad earnings recession, with earnings declining by 5%-10% in the second half of the year.
The End of an Era
The key to the strength of the U.S. market has been the combination of QE with sustained corporate profitability.
The U.S. has been an exception in a world where most equity markets are priced for mediocre growth. “The U.S. is the one market that is priced for the ongoing earnings outperformance that has marked the last 20 years,” he says.
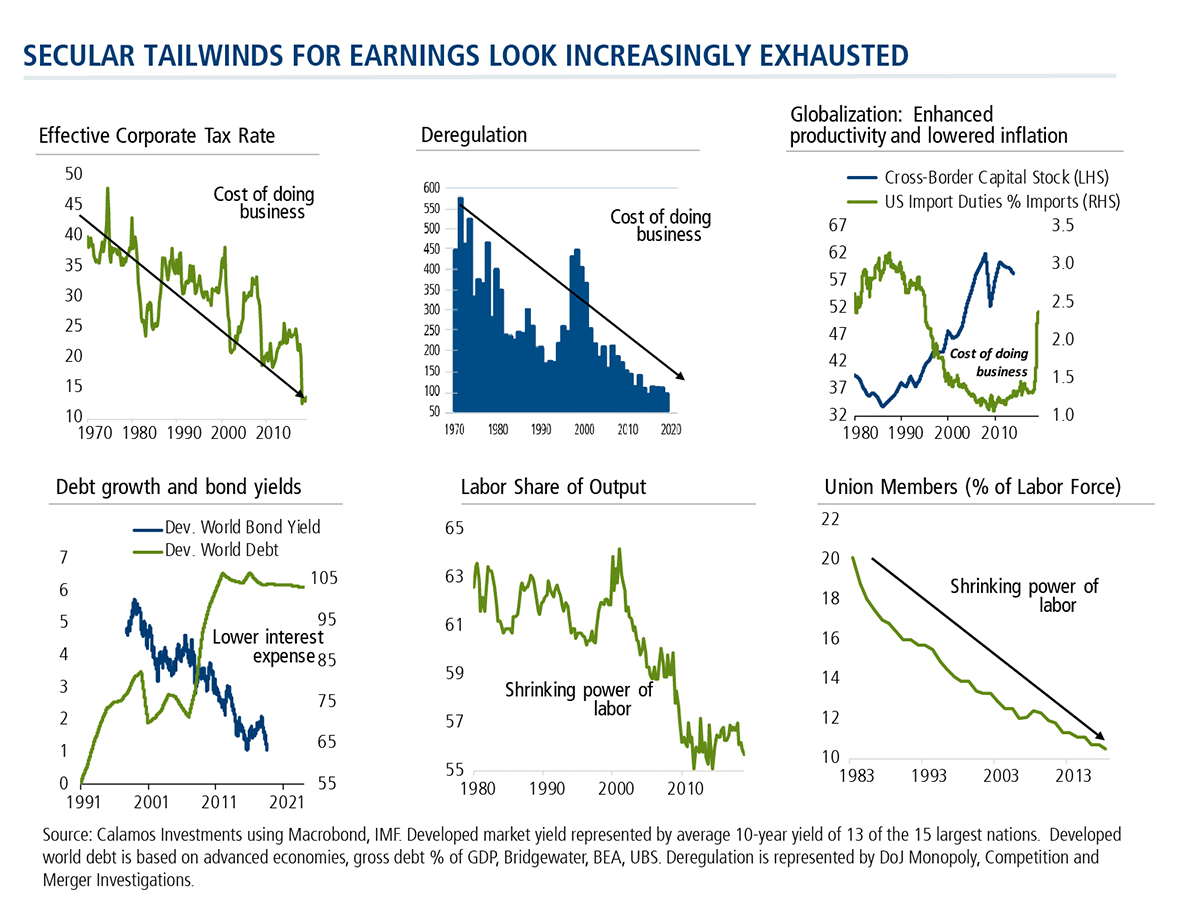
Here’s Grant’s logic for risk-adjusted exposure to U.S. equities at this stage of the cycle. All of the secular tailwinds that have supported earnings look increasingly exhausted:
- The effect of the corporate tax rate, which will be reduced no further.
- The impact of deregulation.
- The impact of globalization—which enhances productivity and lowers inflation whose contribution is in the process of being diminished.
- The benefit of lower interest expense is over. Corporations have accumulated debt, so that interest expense line is going up, not down.
- Labor share of income and the power of labor, all of which the politics are signaling must reverse.
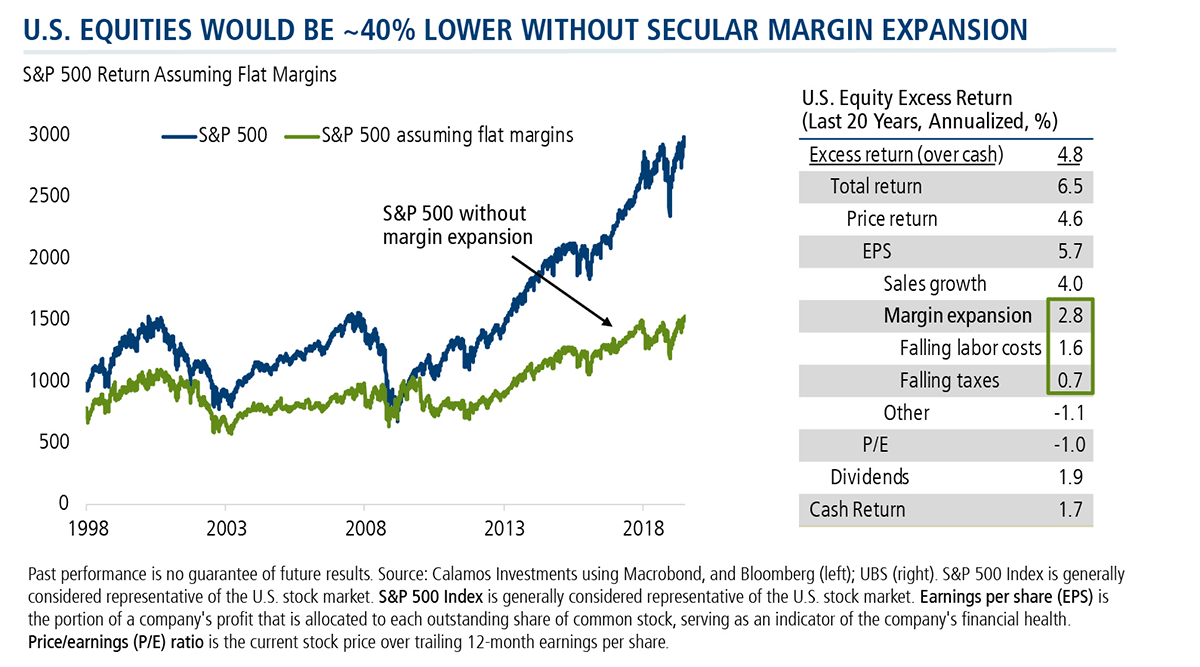
Half of the excess return from equities over the last 20 years came from margin expansion, according to Grant. Without that margin expansion, the S&P 500 would be 40% lower than it is today. It’s the end of an era for U.S. equities, says Grant.
Slowdown or Recession?
When the markets collapsed in December, many concluded that the U.S. was heading into a recession. But the market recovery this year has caused many to backpedal on recession forecasts.
The policies of recent years are a headwind, Grant says. “I don’t want to be a slave to the yield curve, but I don’t want to be so foolish as to ignore it either…We’re approaching a frontier at least for debt markets between slowdown on the one hand and real recessionary risks on the other. And, I think we’re going to get signals from the bond market as to which way it goes in the next three or four months.”
Grant considers a true GDP recession unlikely. At least two conditions not present today would be necessary: a meaningful rise in unemployment or other shock to incomes and stress in corporate credit. He continues to call for a “non-traumatic” transition from the post-2008 bull market through 2020, with the major benchmarks moving “erratically and tediously” within a 25% range. His S&P 500 year-end target is 2850 with a 50 basis point cut.
Financial advisors, for more on Grant’s perspective or for information on CPLIX, contact your Investment Consultant at 888-571-2567 or caminfo@calamos.com.
Before investing, carefully consider the fund’s investment objectives, risks, charges and expenses. Please see the prospectus and summary prospectus containing this and other information which can be obtained by calling 1-866-363-9219. Read it carefully before investing.
Opinions and estimates offered constitute our judgment and are subject to change without notice, as are statements of financial market trends, which are based on current market conditions. We believe the information provided here is reliable, but do not warrant its accuracy or completeness. This material is not intended as an offer or solicitation for the purchase or sale of any financial instrument. The views and strategies described may not be suitable for all investors. This material has been prepared for informational purposes only, and is not intended to provide, and should not be relied on for, accounting, legal or tax advice. References to future returns are not promises or even estimates of actual returns a client portfolio may achieve. Any forecasts contained herein are for illustrative purposes only and are not to be relied upon as advice or interpreted as a recommendation.
An investment in the Fund(s) is subject to risks, and you could lose money on your investment in the Fund(s). There can be no assurance that the Fund(s) will achieve its investment objective. Your investment in the Fund(s) is not a deposit in a bank and is not insured or guaranteed by the Federal Deposit Insurance Corporation (FDIC) or any other government agency. The risks associated with an investment in the Fund(s) can increase during times of significant market volatility. The Fund(s) also has specific principal risks, which are described below. More detailed information regarding these risks can be found in the Fund's prospectus.
The principal risks of investing in Calamos Phineus Long/Short Fund include: equity securities risk consisting of market prices declining in general, short sale risk consisting of potential for unlimited losses, foreign securities risk, currency risk, geographic concentration risk, other investment companies (including ETFs) risk, derivatives risk, options risk, and leverage risk.
Alternative investments are not suitable for all investors.
S&P 500 Index is generally considered representative of the U.S. stock market.
The ISM Manufacturing Index is a widely-watched indicator of recent U.S. economic activity. The index is often referred to as the Purchasing Manager's Index (PMI). Based on a survey of purchasing managers at more than 300 manufacturing firms by the Institute for Supply Management (ISM), the index monitors changes in production levels from month to month.
Archived material may contain dated performance, risk and other information. Current performance may be lower or higher than the performance quoted in the archived material. For the most recent month-end fund performance information visit www.calamos.com. Archived material may contain dated opinions and estimates based on our judgment and are subject to change without notice, as are statements of financial market trends, which are based on current market conditions at the time of publishing. We believed the information provided here was reliable, but do not warrant its accuracy or completeness. This material is not intended as an offer or solicitation for the purchase or sale of any financial instrument. The views and strategies described may not be suitable for all investors. This material has been prepared for informational purposes only, and is not intended to provide, and should not be relied on for, accounting, legal or tax advice. References to future returns are not promises or even estimates of actual returns a client portfolio may achieve. Any forecasts contained herein are for illustrative purposes only and are not to be relied upon as advice or interpreted as a recommendation.
Performance data quoted represents past performance, which is no guarantee of future results. Current performance may be lower or higher than the performance quoted. The principal value and return of an investment will fluctuate so that your shares, when redeemed, may be worth more or less than their original cost. Performance reflected at NAV does not include the Fund’s maximum front-end sales load. Had it been included, the Fund’s return would have been lower.
Archived on August 04, 2020