CICVX Offered a Better Experience—and a Better Return—Since Equity Volatility Has Returned
June 7, 2019
Investment gains through exposure to equities? Some think the only way to get there is to jump in the stock market and endure all its exhilarating ups and nerve-wracking downs. To do anything less—some believe—is to forgo the maximum of what’s possible.
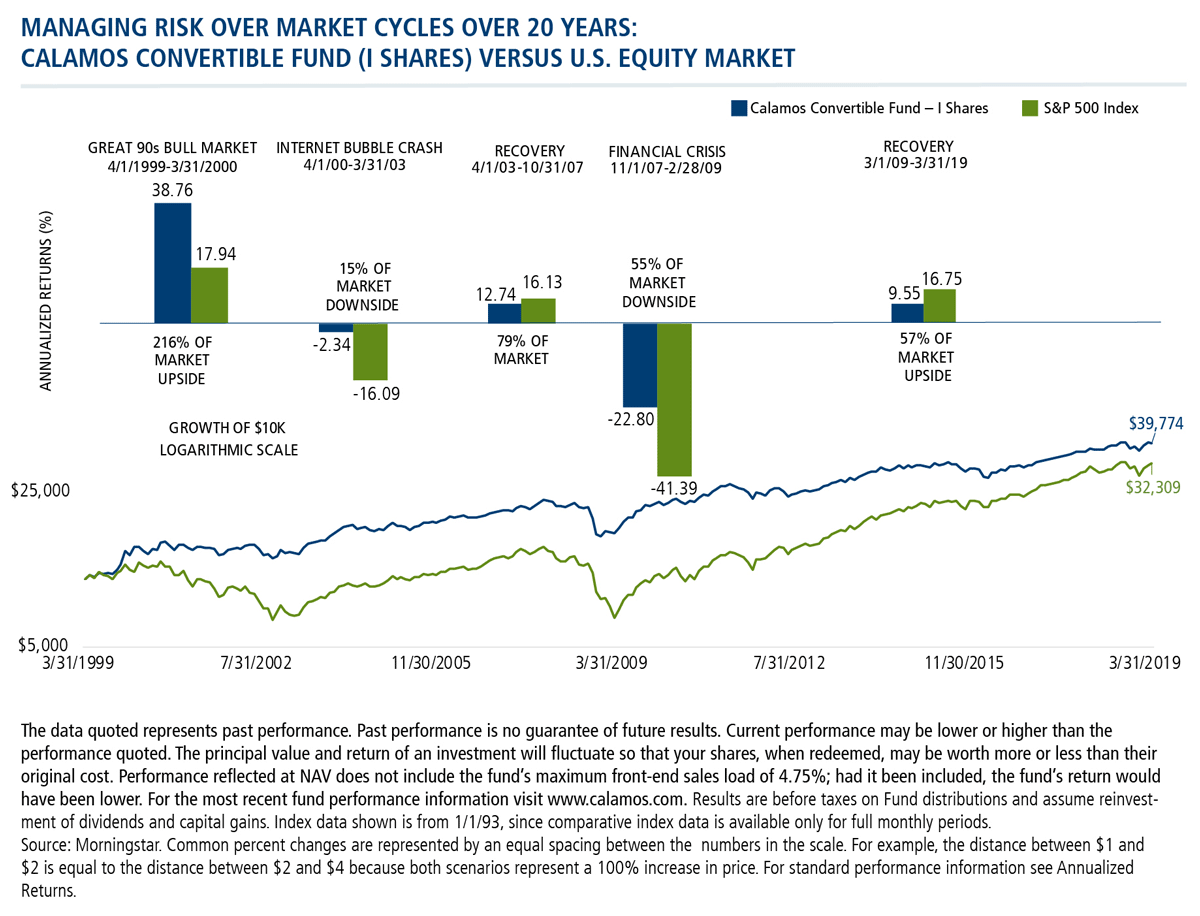
Conceptually, investors understand the benefit of limiting the downside. But there can be a second part to that benefit. Here, according to Calamos Senior Vice President, Co-Portfolio Manager Joseph Wysocki, is what many don’t understand: “Potentially protecting against the downside doesn’t just mean you don’t lose as much, it can lead to more upside through market cycles.”
To illustrate: After 2017 ended as the least volatile year since the VIX’s inception, 2018 and 2019 year-to-date have taken equity investors for quite a ride. Consider what’s occurred over the last 17 months—the Fed changed direction, global, synchronized growth did a fast fade, and trade conflicts now abound, all of which fired off multiple mini-corrections in the S&P 500.
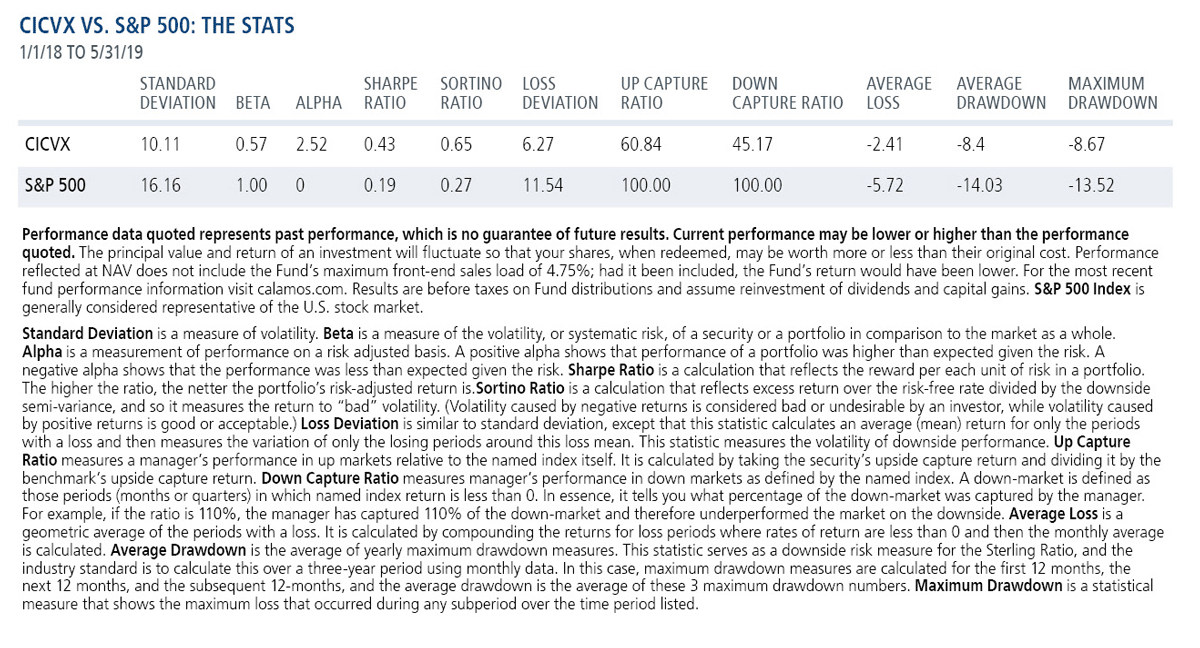
For the U.S. equity-only portfolio, the reward for hanging in there through it all was a 5.88% return from January 1, 2018, through May 31, 2019. But look how Calamos Convertible Fund (CICVX) fared. Its 8.79% gain exceeded the S&P, thanks to its portfolio of convertible securities that are actively managed with the intent of participating in equity upside with potentially less exposure to the downside.

CICVX offered financial advisors an alternative way to manage equity risk in clients’ portfolios without surrendering investment return. To the contrary, over this period, CICVX provided an almost 300 basis point advantage.
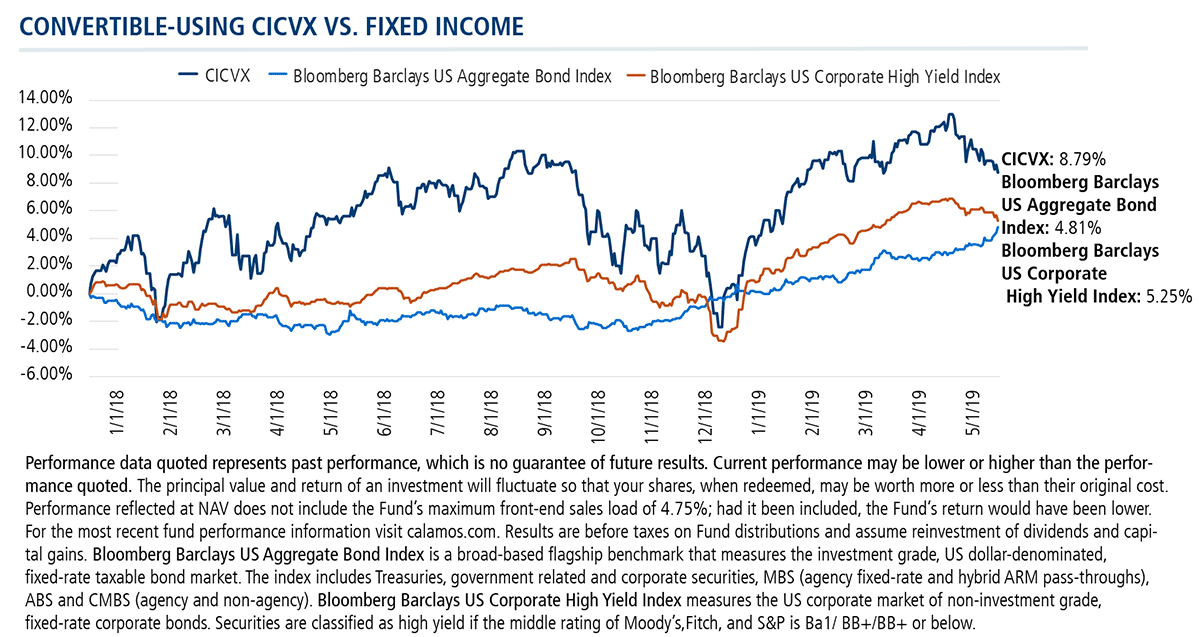
Finally, here’s a comparison of how fixed income and high yield performed over this same volatile period. Here, too, CICVX outperformed on an absolute return basis and—especially important for clients monitoring their portfolios throughout the period—rarely dipped into negative territory over the same time period.
CICVX’s ability to manage through the market risks since the start of 2018 is a short-term example of how convertibles can achieve equity-like returns with lower standard deviations and shallower drawdowns. Executing on this strategy over the longer term can be key to compounding returns and lead to periods of outperformance over full market cycles.
Advisors, for more information on CICVX, contact your Calamos Investment Consultant at 888-571-2567 or caminfo@calamos.com.
Click here to view CICVX's standardized performance.
Before investing, carefully consider the fund’s investment objectives, risks, charges and expenses. Please see the prospectus and summary prospectus containing this and other information which can be obtained by calling 1-866-363-9219. Read it carefully before investing.
The principal risks of investing in the Calamos Convertible Fund include: convertible securities risk consisting of the potential for a decline in value during periods of rising interest rates and the risk of the borrower to miss payments, synthetic convertible instruments risk consisting of fluctuations inconsistent with a convertible security and the risk of components expiring worthless, foreign securities risk, equity securities risk, interest rate risk, credit risk, high yield risk, portfolio selection risk and liquidity risk. As a result of political or economic instability in foreign countries, there can be special risks associated with investing in foreign securities, including fluctuations in currency exchange rates, increased price volatility and difficulty obtaining information. In addition, emerging markets may present additional risk due to potential for greater economic and political instability in less developed countries.
Bloomberg Barclays US Aggregate Bond Index is a broad-based flagship benchmark that measures the investment grade, US dollar-denominated, fixed-rate taxable bond market. The index includes Treasuries, government related and corporate securities, MBS (agency fixed-rate and hybrid ARM pass-throughs), ABS and CMBS (agency and non-agency).
Bloomberg Barclays US Corporate High Yield Index measures the US corporate market of non-investment grade, fixed-rate corporate bonds. Securities are classified as high yield if the middle rating of Moody’s,Fitch, and S&P is Ba1/ BB+/BB+ or below.
S&P 500 Index-Is generally considered representative of the U.S. stock market.
801612 619
Archived material may contain dated performance, risk and other information. Current performance may be lower or higher than the performance quoted in the archived material. For the most recent month-end performance information, please CLICK HERE. Archived material may contain dated opinions and estimates based on our judgment and are subject to change without notice, as are statements of financial market trends, which are based on current market conditions at the time of publishing. We believed the information provided here was reliable, but do not warrant its accuracy or completeness. This material is not intended as an offer or solicitation for the purchase or sale of any financial instrument. The views and strategies described may not be suitable for all investors. This material has been prepared for informational purposes only, and is not intended to provide, and should not be relied on for, accounting, legal or tax advice. References to future returns are not promises or even estimates of actual returns a client portfolio may achieve. Any forecasts contained herein are for illustrative purposes only and are not to be relied upon as advice or interpreted as a recommendation.
Performance data quoted represents past performance, which is no guarantee of future results. Current performance may be lower or higher than the performance quoted. The principal value and return of an investment will fluctuate so that your shares, when redeemed, may be worth more or less than their original cost. Performance reflected at NAV does not include the Fund’s maximum front-end sales load. Had it been included, the Fund’s return would have been lower. For the most recent month-end fund performance information visit www.calamos.com.
Archived material may contain dated performance, risk and other information. Current performance may be lower or higher than the performance quoted in the archived material. For the most recent month-end fund performance information visit www.calamos.com. Archived material may contain dated opinions and estimates based on our judgment and are subject to change without notice, as are statements of financial market trends, which are based on current market conditions at the time of publishing. We believed the information provided here was reliable, but do not warrant its accuracy or completeness. This material is not intended as an offer or solicitation for the purchase or sale of any financial instrument. The views and strategies described may not be suitable for all investors. This material has been prepared for informational purposes only, and is not intended to provide, and should not be relied on for, accounting, legal or tax advice. References to future returns are not promises or even estimates of actual returns a client portfolio may achieve. Any forecasts contained herein are for illustrative purposes only and are not to be relied upon as advice or interpreted as a recommendation.
Performance data quoted represents past performance, which is no guarantee of future results. Current performance may be lower or higher than the performance quoted. The principal value and return of an investment will fluctuate so that your shares, when redeemed, may be worth more or less than their original cost. Performance reflected at NAV does not include the Fund’s maximum front-end sales load. Had it been included, the Fund’s return would have been lower.
Archived on June 06, 2020