CGIIX Called ‘One of the 7 Best Balanced Funds to Pick Right Now’
March 16, 2021
U.S. News Methodology
The U.S. News Mutual Fund Score is produced using an equal weighting of the overall ratings provided by our data sources.
Individual fund rating systems are normalized to a 100-point scale based on point totals assigned to individual scoring systems. For Morningstar's and CFRA's five-Star ranking and Zacks five-point scale, each star or point awarded would receive 20 points. In TheStreet.com's A-to-E scale, a highly rated "A" fund would receive 100 points, while a low-rated "E" would receive 20 points. The five Lipper Leader categories are each worth a total of 20 points, giving 4 points to each 1-to-5 point scale assigned to each section of the Lipper rankings. The U.S. News score is calculated by dividing total points awarded according to the above system by the number data sources (5). The combined U.S. News Mutual Fund Score ranks funds numerically based on this score. Funds with identical scores to one decimal place are awarded the same numerical ranking.
Calamos Growth and Income Fund (CGIIX) stands out among balanced funds with the different approach it takes to offering clients a mix of asset classes in pursuit of a steadier path toward capital appreciation. This approach—including the use of convertible securities along with common stocks to reduce more traditional fixed income exposure and provide asset class diversification—was recently acknowledged by U.S. News and World Report.
CGIIX this month was called out as “one of the seven best balanced funds to pick right now.” CGIIX tops the publication’s ranking of funds in Morningstar’s Allocation—70% to 85% Equity Category.
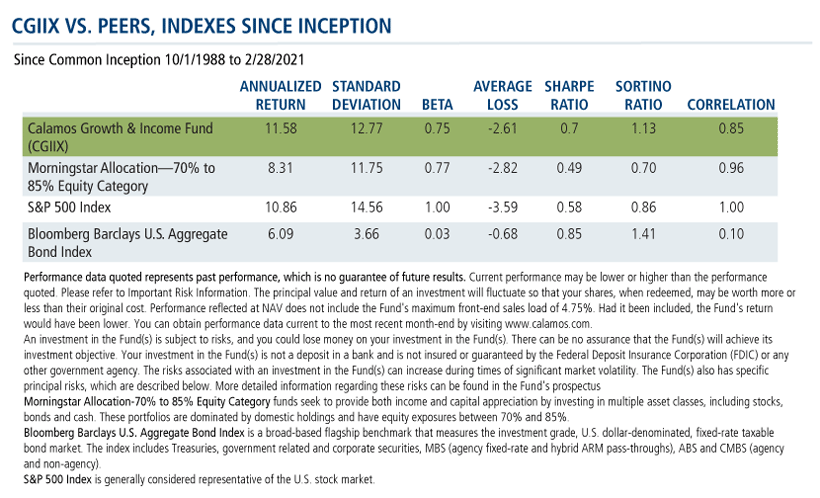
Since the fund’s inception, CGIIX has outperformed peers from a total return and risk-adjusted return perspective with similar levels of equity market risk (beta), lower correlation to the equity markets, and less severe loss/drawdowns, notes Elise Pondel, CFA, in Calamos Strategic Product Management & Analytics.
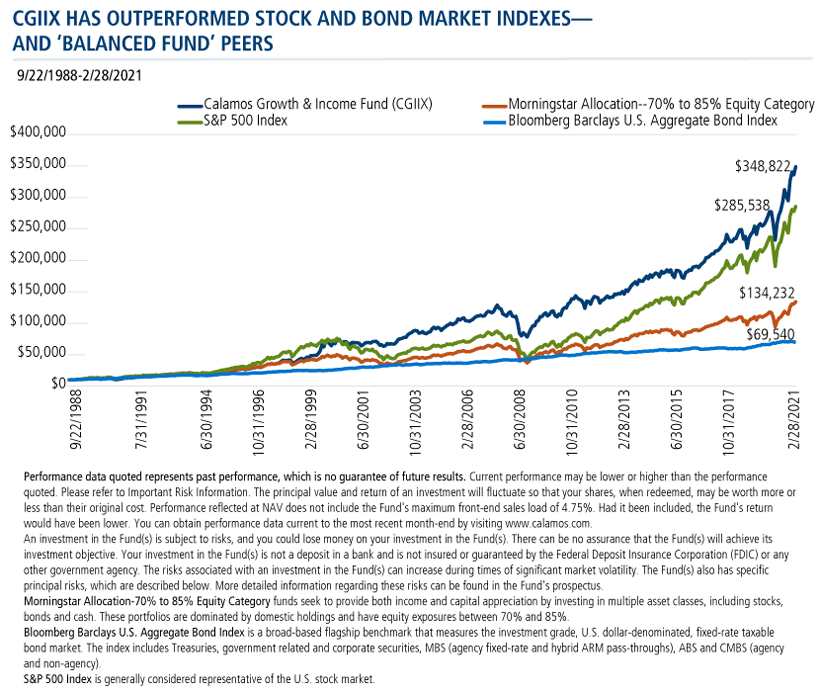
Investors in CGIIX since its inception would have seen their $10,000 investment grow to $348,822—or more than 2.5 times an investment in the Morningstar Allocation—70% to 85% Equity peer group.
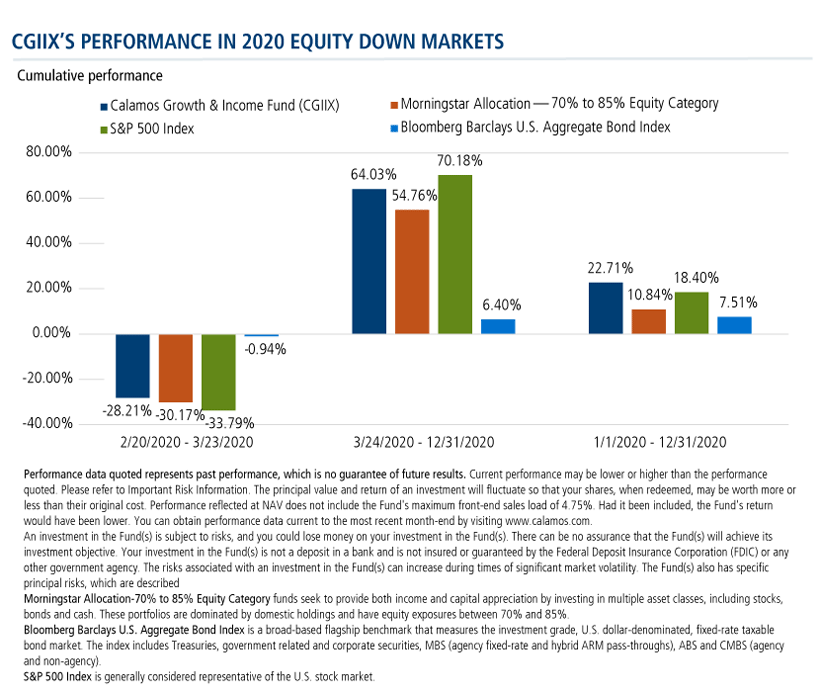
The charts below show CGIIX’s resilience in dealing with the very different scenarios of this year and last.
When the S&P 500 fell almost 34% last spring, CGIIX declined less, breaking the fall for shareholders relative to the equity market and its peer group. When the market roared back, CGIIX staged a rebound that outperformed its peers by over 900 basis points. The fund finished the year ahead not just of its peer group but more than 400 basis points ahead of the S&P 500.
For reference this year, as rates head higher: CGIIX has generally outperformed during past periods of rising interest rates. This includes the most recent race to 102 basis points higher from August 2020 to February 2021. Compare these results against allocation funds’, whose exposure to traditional fixed income can be a drag on the portfolio when rates rise.
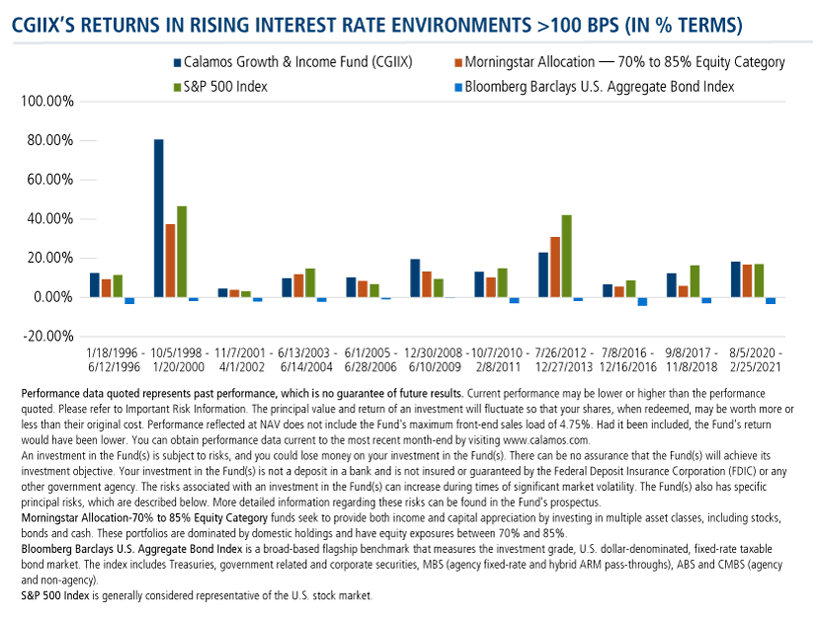
Investment professionals, for an alternative to allocation funds, turn to CGIIX to provide greater upside potential (with greater volatility as a tradeoff) and stronger resilience during periods of rising interest rates. To learn more, contact your Calamos Investment Consultant at 888-571-2567 or caminfo@calamos.com.
Before investing, carefully consider the fund’s investment objectives, risks, charges and expenses. Please see the prospectus and summary prospectus containing this and other information which can be obtained by calling 1-866-363-9219. Read it carefully before investing.
Opinions and estimates offered constitute our judgment and are subject to change without notice, as are statements of financial market trends, which are based on current market conditions. We believe the information provided here is reliable, but do not warrant its accuracy or completeness. This material is not intended as an offer or solicitation for the purchase or sale of any financial instrument. The views and strategies described may not be suitable for all investors. This material has been prepared for informational purposes only, and is not intended to provide, and should not be relied on for, accounting, legal or tax advice. References to future returns are not promises or even estimates of actual returns a client portfolio may achieve. Any forecasts contained herein are for illustrative purposes only and are not to be relied upon as advice or interpreted as a recommendation.
The principal risks of investing in Calamos Growth and Income Fund include: convertible securities risk consisting of the potential for a decline in value during periods of rising interest rates and the risk of the borrower to miss payments, synthetic convertible instruments risk consisting of fluctuations inconsistent with a convertible security and the risk of components expiring worthless, equity securities risk, growth stock risk, small and mid-sized company risk, interest rate risk, credit risk, liquidity risk, high yield risk, forward foreign currency contract risk and portfolio selection risk.
Bloomberg Barclays U.S. Aggregate Bond Index is a broad-based flagship benchmark that measures the investment grade, U.S. dollar-denominated, fixed-rate taxable bond market. The index includes Treasuries, government related and corporate securities, MBS (agency fixed-rate and hybrid ARM pass-throughs), ABS and CMBS (agency and non-agency).
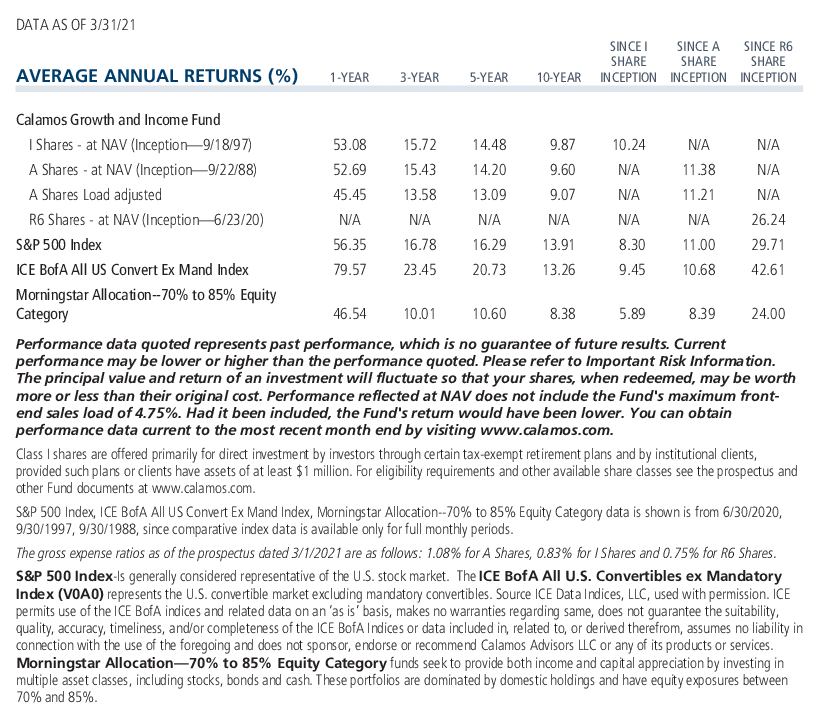
S&P 500 Index is generally considered representative of the U.S. stock market.
Morningstar Allocation—70% to 85% Equity funds seek to provide both income and capital appreciation by investing in multiple asset classes, including stocks, bonds and cash. These portfolios are dominated by domestic holdings and have equity exposures between 70% and 85%.
Beta is a measure of the volatility, or systematic risk, of a security or a portfolio in comparison to the market as a whole.
Sharpe ratio is a calculation that reflects the reward per each unit of risk in a portfolio. The higher the ratio, the better the portfolio's risk-adjusted return is.
Sortino ratio is an excess return over the risk-free rate divided by the downside semi-variance, and so it measures the return to “bad” volatility. (Volatility caused by negative returns is considered bad or undesirable by an investor, while volatility caused by positive returns is good or acceptable.)
Standard deviation is a measure of volatility.
802329 321
Archived material may contain dated performance, risk and other information. Current performance may be lower or higher than the performance quoted in the archived material. For the most recent month-end fund performance information visit www.calamos.com. Archived material may contain dated opinions and estimates based on our judgment and are subject to change without notice, as are statements of financial market trends, which are based on current market conditions at the time of publishing. We believed the information provided here was reliable, but do not warrant its accuracy or completeness. This material is not intended as an offer or solicitation for the purchase or sale of any financial instrument. The views and strategies described may not be suitable for all investors. This material has been prepared for informational purposes only, and is not intended to provide, and should not be relied on for, accounting, legal or tax advice. References to future returns are not promises or even estimates of actual returns a client portfolio may achieve. Any forecasts contained herein are for illustrative purposes only and are not to be relied upon as advice or interpreted as a recommendation.
Performance data quoted represents past performance, which is no guarantee of future results. Current performance may be lower or higher than the performance quoted. The principal value and return of an investment will fluctuate so that your shares, when redeemed, may be worth more or less than their original cost. Performance reflected at NAV does not include the Fund’s maximum front-end sales load. Had it been included, the Fund’s return would have been lower.
Archived on March 16, 2022