
Don't Make This Mistake with Convertible Bond Funds
June 1, 2017
Of course, we’d argue that convertible securities are appropriate for strategic portfolio allocations, as a means of seeking lower volatility equity exposure over full and multiple market cycles.
But as interest rates rise, it’s that time in the cycle when many advisors are turning to convertibles for shorter-term tactical overweights. Convertible bonds, which combine characteristics of stocks and traditional fixed-income securities, have historically outperformed fixed income during periods of rising interest rates (see the analysis in our Readying Your Clients’ Portfolios for Rising Interest Rates post).
If you’re evaluating convertible funds now, make sure you recognize the difference between what an actively managed fund does versus a passive.
The Complexities of a Single Security and the Market as a Whole
In our view, those who seek to buy “the market” via a passive fund defeat the purpose of investing in convertibles securities. Here’s why:
- Convertibles combine characteristics of stocks and traditional fixed income securities, providing unique opportunities for managing risk and enhancing returns.
- The characteristics of a single convertible may change over time. Convertible securities have varying degrees of equity and fixed income sensitivity, and these characteristics may change for a given convertible over time.
- At various times, the convertible market as a whole—and thereby the passive fund tracking it—may look a lot like the equity market and other times a lot like the bond market.
In the image below, the first graph depicts the convertible market on March 1, 2000, as the equity market was peaking and the technology bubble was just about to burst. An investor who had favored a passive or index-like convertible strategy would have been overexposed to equity downside.
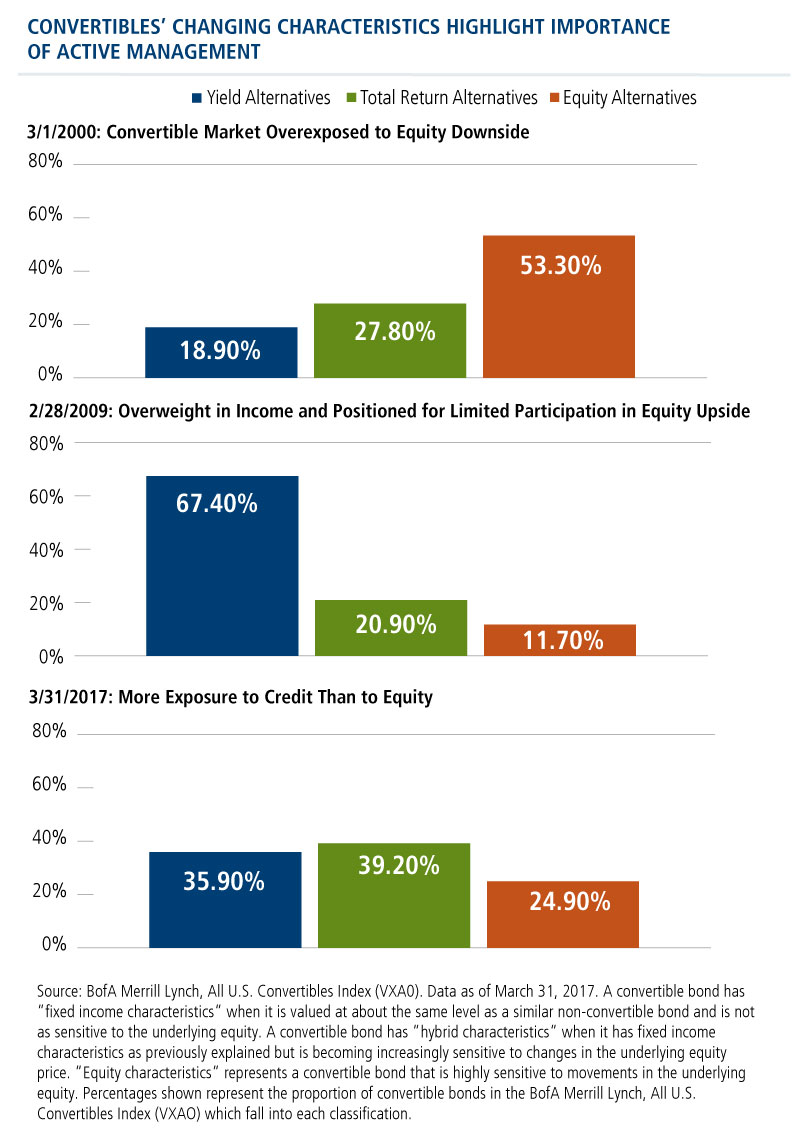
By February of 2009 (second graph), the pendulum had swung to the other extreme. As the markets troughed in the liquidity crisis, more than two-thirds of convertibles were trading as “credit-sensitive.” An investor who chose to mimic the broad market would have been positioned for limited participation in the equity market’s subsequent upside.
The third graph shows the market as of March 31, 2017, the latest data available. Here again, the market tilted more toward credit than toward equity—is that what you want at this point?
What Active Management Can Do
It's not simply the use of convertibles in a strategy that makes it work, but how convertibles are used to achieve a particular investment objective.
We believe active management is necessary in order to maximize the potential benefits of exposure to convertible securities. Passive strategies can’t adjust to changes in either an individual convertible’s characteristics or to the characteristics of the convertible universe as a whole.
A passive strategy that just follows where the market goes misses out on the opportunity that an active manager has to rebalance and optimize risk/reward.
As an active manager whose Founder, Chairman and Global CIO John P. Calamos, Sr. is generally credited for pioneering the use of convertible securities, Calamos’ focus is on trying to achieve the best possible risk-reward so we can participate in the upside of the equity market while also cushioning the downside.
In a core allocation, the most equity-sensitive convertibles may be too vulnerable over the long term to downside movements in the market. The most credit-sensitive convertibles might not provide enough opportunity for upside participation. Our objective as an active manager is to identify convertibles that offer balanced attributes, a blend of credit and equity sensitivities.
The Benefit of Balance
The table below shows the outcome—annualized returns and standard deviations—of actively optimizing for total return over several recent market cycles.
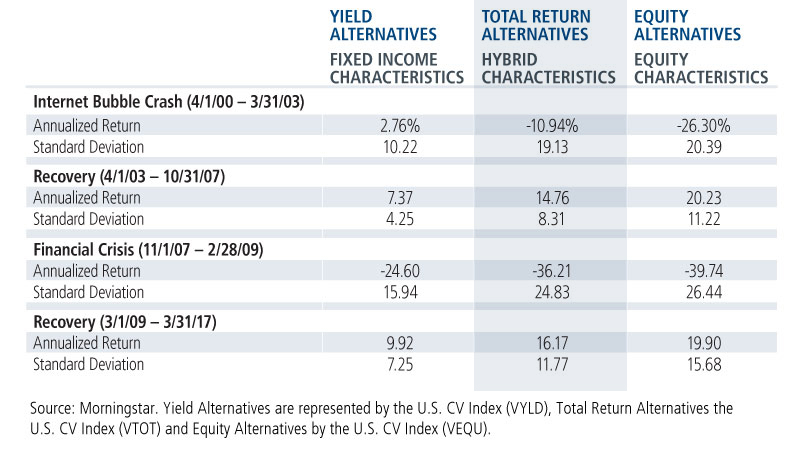 Convertibles with total return characteristics provided:
- Participation in rising equity markets
- Greater downside protection than the more equity-sensitive issues during declining markets
In short, active management of a convertible bond fund can consistently pursue total return.
Financial advisors, for more information on any of the Calamos funds that use convertible securities, please see the Related Funds section or talk to your Calamos Investment Consultant at 888-571-2567 or caminfo@calamos.com.
Additional Resources
- The Case for Strategic Convertible Allocations
- Convertible Securities: Structures, Valuation, Market Environment and Asset Allocation
Before investing, carefully consider the fund’s investment objectives, risks, charges and expenses. Please see the prospectus and summary prospectus containing this and other information which can be obtained by calling 1-866-363-9219. Read it carefully before investing.
Diversification and asset allocation do not guarantee against a loss. This material is distributed for informational purposes only. The information contained herein is based on internal research derived from various sources and does not purport to be statements of all material facts relating to the information mentioned, and while not guaranteed as to the accuracy or completeness, has been obtained from sources we believe to be reliable.
Opinions, estimates, forecasts, and statements of financial market trends that are based on current market conditions constitute our judgment and are subject to change without notice. The views and strategies described may not be suitable for all investors. References to specific securities, asset classes and financial markets are for illustrative purposes only and are not intended to be, and should not be interpreted as, recommendations.
Convertible securities entail interest rate risk and default risk.
Total return assumes reinvestment of dividends and capital gains distributions and reflects the deduction of any sales charges, where applicable. Performance may reflect the waiver of a portion of the Fund's advisory or administrative fees for certain periods since the inception date. If fees had not been waived, performance would have been less favorable.
When we discuss volatility, our focus is on the variation of returns in our equity Funds versus a full equity benchmark such as the MSCI World Index. We consider a fund to have lower volatility when its beta versus the equity benchmark is less than one. Beta is an historic measure of a fund’s relative volatility, which is one of the measures of risk. For example, a beta of 0.5 reflects half of the market’s volatility versus the index, while a beta of 2.0 would indicate twice the volatility of the index. From this perspective, the fund has a lower risk profile than its benchmark. There is no assurance that a fund will achieve or deliver low volatility results.
Standard deviation is applied to the annual rate of return of an investment to measure the investment’s volatility. Standard deviation is also known as historical volatility and is used by investors as a gauge for the amount of expected volatility.
Beta is an historic measure of a fund’s relative volatility, which is one of the measures of risk; a beta of 0.5 reflects 1/2 the market’s volatility as represented by the fund’s primary benchmark, while a beta of 2.0 reflects twice the volatility.
Indexes are unmanaged, do not entail fees or expenses and are not available for direct investment. Unless otherwise noted, index returns reflect the reinvestment of income dividends and capital gains, if any, but do not reflect fees, brokerage commissions or other expenses of investing. Investors may not make direct investments into any index.
The S&P 500 Index is considered generally representative of the U.S. equity market.
The Bank of America Merrill Lynch Global 300 Convertible Index (VG00) is a global convertible index composed of companies representative of the market structure of countries in North America, Europe and the Asia/Pacific region. The MSCI World Index is a market capitalization weighted index composed of companies representative of the market structure of developed market countries in North America, Europe, and the Asia/Pacific region.
Yield Alternatives are represented by the VYLD All Yield Alternatives U.S. Convertible Index. Equity Alternatives are represented by the VEQU All Equity Alternatives U.S. Convertible Index. Total Return Alternatives are represented by the VTOT All Total Return Alternatives U.S. Convertible Index.
A convertible bond is at a “distressed” valuation when it is worth significantly less than the theoretical value of a similar non-convertible bond and is highly sensitive to changes in the underlying equity price. A convertible bond has “fixed income characteristics” when it is valued at about the same level as a similar non-convertible bond and is not as sensitive to the underlying equity. A convertible bond has “hybrid characteristics” when it has fixed income characteristics as previously explained but is becoming increasingly sensitive to changes in the underlying equity price. “Equity characteristics” represents a convertible bond that is highly sensitive to movements in the underlying equity.
Active management does not guarantee investment returns and does no eliminate the risk of loss.
NOT FDIC INSURED | MAY LOSE VALUE | NO BANK GUARANTEE
800208 -5/17
Archived material may contain dated performance, risk and other information. Current performance may be lower or higher than the performance quoted in the archived material. For the most recent month-end performance information, please CLICK HERE. Archived material may contain dated opinions and estimates based on our judgment and are subject to change without notice, as are statements of financial market trends, which are based on current market conditions at the time of publishing. We believed the information provided here was reliable, but do not warrant its accuracy or completeness. This material is not intended as an offer or solicitation for the purchase or sale of any financial instrument. The views and strategies described may not be suitable for all investors. This material has been prepared for informational purposes only, and is not intended to provide, and should not be relied on for, accounting, legal or tax advice. References to future returns are not promises or even estimates of actual returns a client portfolio may achieve. Any forecasts contained herein are for illustrative purposes only and are not to be relied upon as advice or interpreted as a recommendation.
Performance data quoted represents past performance, which is no guarantee of future results. Current performance may be lower or higher than the performance quoted. The principal value and return of an investment will fluctuate so that your shares, when redeemed, may be worth more or less than their original cost. Performance reflected at NAV does not include the Fund’s maximum front-end sales load. Had it been included, the Fund’s return would have been lower. For the most recent month-end fund performance information visit www.calamos.com.
Archived material may contain dated performance, risk and other information. Current performance may be lower or higher than the performance quoted in the archived material. For the most recent month-end fund performance information visit www.calamos.com. Archived material may contain dated opinions and estimates based on our judgment and are subject to change without notice, as are statements of financial market trends, which are based on current market conditions at the time of publishing. We believed the information provided here was reliable, but do not warrant its accuracy or completeness. This material is not intended as an offer or solicitation for the purchase or sale of any financial instrument. The views and strategies described may not be suitable for all investors. This material has been prepared for informational purposes only, and is not intended to provide, and should not be relied on for, accounting, legal or tax advice. References to future returns are not promises or even estimates of actual returns a client portfolio may achieve. Any forecasts contained herein are for illustrative purposes only and are not to be relied upon as advice or interpreted as a recommendation.
Performance data quoted represents past performance, which is no guarantee of future results. Current performance may be lower or higher than the performance quoted. The principal value and return of an investment will fluctuate so that your shares, when redeemed, may be worth more or less than their original cost. Performance reflected at NAV does not include the Fund’s maximum front-end sales load. Had it been included, the Fund’s return would have been lower.
Archived on June 01, 2018