
As investors, we naturally aim to understand what is and what is not discounted by financial markets. Of course, this is a difficult feat as it implies we know something about our stocks that others do not. Since the turn of the century, markets have become more informationally efficient and rapidly incorporate new information into stock prices.
Rather than just ask “what do we know that others do not?”, our Global Long/Short team likes to explore the deeper questions about investor beliefs. These determine how investors incorporate information into the investment problem itself and thus, how they arrive at their decisions.
We all bring all kinds of beliefs to the investment task. For example, some believe that value investing works and valuation inputs should be paramount. Others prefer to invest in growth stocks and dismiss the value of dividends. Some believe that technical analysis is superior to a fundamental approach and so forth. But how do investors arrive at these beliefs and what is the evidence for such?
One commonly held assumption is that today’s financial landscape is dangerously fragile. This is the outcome of the trauma of the Global Financial Crisis and its aftermath in particular. Are investors correct that unforeseen risks lurk around every corner? Only time will tell. But one sanguine perspective is illustrated below, the Overall Index of Systemic Vulnerability constructed by the Federal Reserve. This implies that the structural risks, which culminated in the Global Financial Crisis of 2008, are no longer present.
Figure 1. The Financial and Economic Landscape: Stronger than Many Believe? Overall Index of Systemic Vulnerability
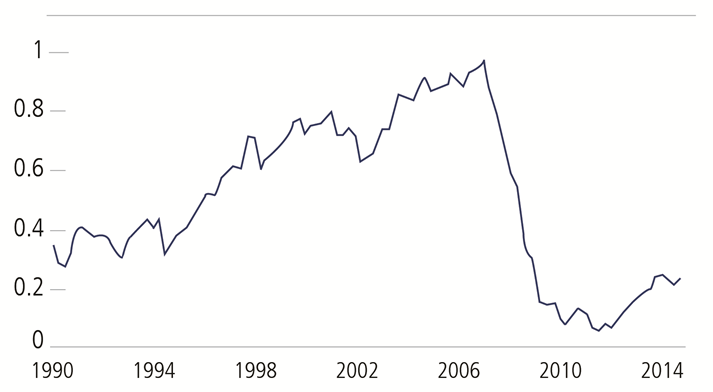
Source: Federal Reserve, quarterly data. The Overall Index of Systemic Vulnerability is constructed using inputs for Risk Appetite and Asset Valuations, Financial Sector Vulnerability, and Nonfinancial Sector Imbalances; more detail can be found here: https://www.federalreserve.gov/econresdata/notes/feds-notes/2015/mapping-heat-in-the-us-financial-system-a-summary-20150805.html
If investor belief in economic fragility is misplaced, as the chart above implies, is everyone overpaying for “safety stocks”? For example, many consumer staples stocks trade at premiums to the market and to their own history despite negligible growth. Investors appear to be paying for the stability and defensiveness of these companies rather than their long-term potential.
Another widespread belief is that the S&P 500 Index is “overvalued” and thus, lacks upside potential. As shown in Figure 2, the median P/E for the S&P 500 is higher today than its average of the past 50 years. That said, stocks have been sustained near today’s valuations for long periods, including the bull market of the 1990s.
Figure 2. Is the S&P 500 Overvalued? S&P 500 Index, Monthly data 3/31/1964 to 3/31/2016 (Log Scale)
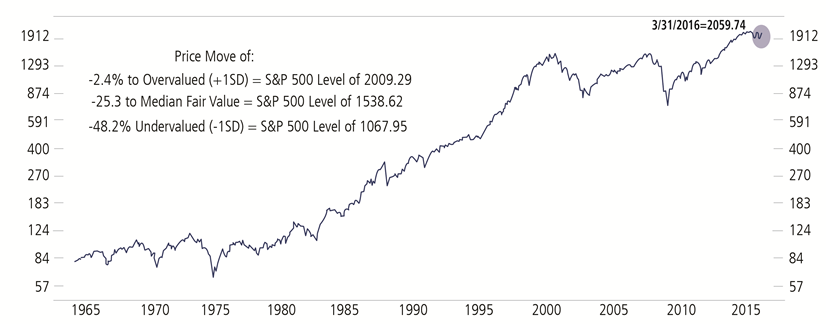
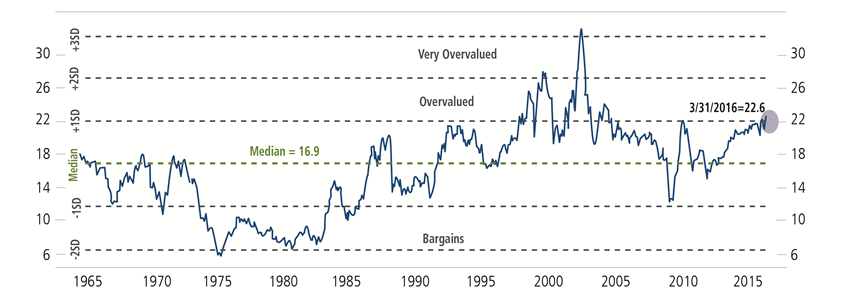
Past performance is no guarantee of future results. Source: Ned Davis Research. Median Price/Earnings ratio is calculated by Ned Davis Research. SD: Standard deviation. Copyright 2016 Ned Davis Research, Inc. Further distribution prohibited without prior permission. All Rights Reserved. See NDR Disclaimer at www.ndr.com/copyright.html. For data vendor disclaimers refer to www.ndr.com/vendorinfo/.
Figure 3 below compares S&P 500 sector valuations in 1992 versus today. Why 1992? Because it is hard to believe that U.S. equities were “overvalued” in the early 1990s, the preamble to the equity gains of the subsequent 8 years. In 1992, the S&P 500 traded on an average P/E multiple of 14.3x. In the first quarter of 2016, the S&P 500 traded on an average P/E of 16.4x, which assumes earnings of about $120/share.
Figure 3. P/E Multiples by Sector (x) Quarterly Data, 3/31/1947 to 12/31/2015, Log Scale

Past performance is no guarantee of future results. Source: UBS and Factset; multiples are calculated as 12-month average.
The bulk (80%) of this valuation difference is accounted for by the “safety” sectors (32%) plus energy (37%) and financials (11%). For example, consumer staples and utilities traded on multiples of 16.1x and 12.0x respectively in 1992 versus 20.6x and 17.4x today. While financials and energy also trade on higher P/E multiples today, this reflects their compressed earnings base. On a price/book basis, for example, financials are trading cheaper today: 1.3x book value versus 1.6x book value in 1992.
What does all of this imply for what we should be thinking about?
- If investors are “overpaying” for stability in sectors like consumer staples and utilities, how quickly could that sentiment reverse?
One insight may be the energy MLP stocks. These had been regarded as safe “bond proxies” when investors were reaching for yield. After peaking in 2014, these stocks lost more than half their value as their underlying business models proved far less defensive than investors had supposed. - Is overvaluation a headwind for the S&P 500, or is it more the pace of future earnings growth?
We think the resumption of the earnings cycle is the critical variable and will overcome investor concerns about valuation. This is why the debate over secular stagnation versus normalization of global growth is worth monitoring. - Treasury bonds are regarded as the ultimate safe asset. How vulnerable are fixed income markets to a modest return of confidence in the economic outlook?
If U.S. inflation drifts mildly higher, we see the potential for nominal GDP growth of 4%. As Treasury yields tend to equal growth in nominal GDP over the long term, the upside from current yields (1.78%) is significant.
Getting markets right is as much about formulating the right questions as knowing the right answers.