The historical performance of Calamos Phineus Long/Short Fund (CPLIX) over what Senior Portfolio Co-Manager Michael Grant calls “the last 15 extraordinary years” is critical for advisors seeking to understand the fund.
Advisors considering CPLIX for their clients’ portfolios find that the fund’s response to different market cycles checks several boxes:
Equity-like Returns with a Superior Risk Profile
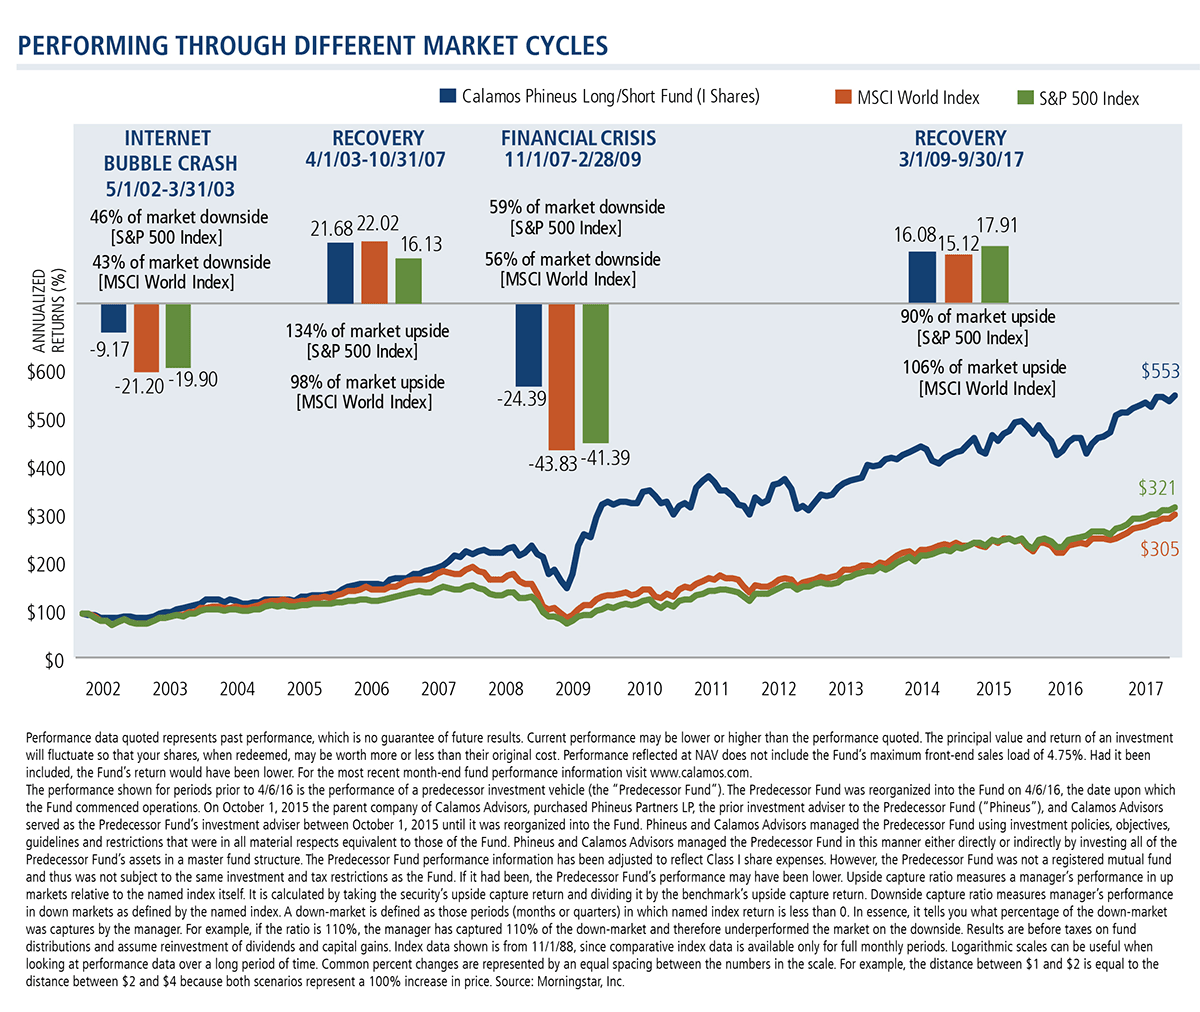
As illustrated below, the fund has prevailed through market adversity (e.g., the internet bubble crash of 2002-2003 and the financial crisis of 2007-2008) and the subsequent recovery periods of 2003-2007 and 2009 to the present.
Performance Consistency
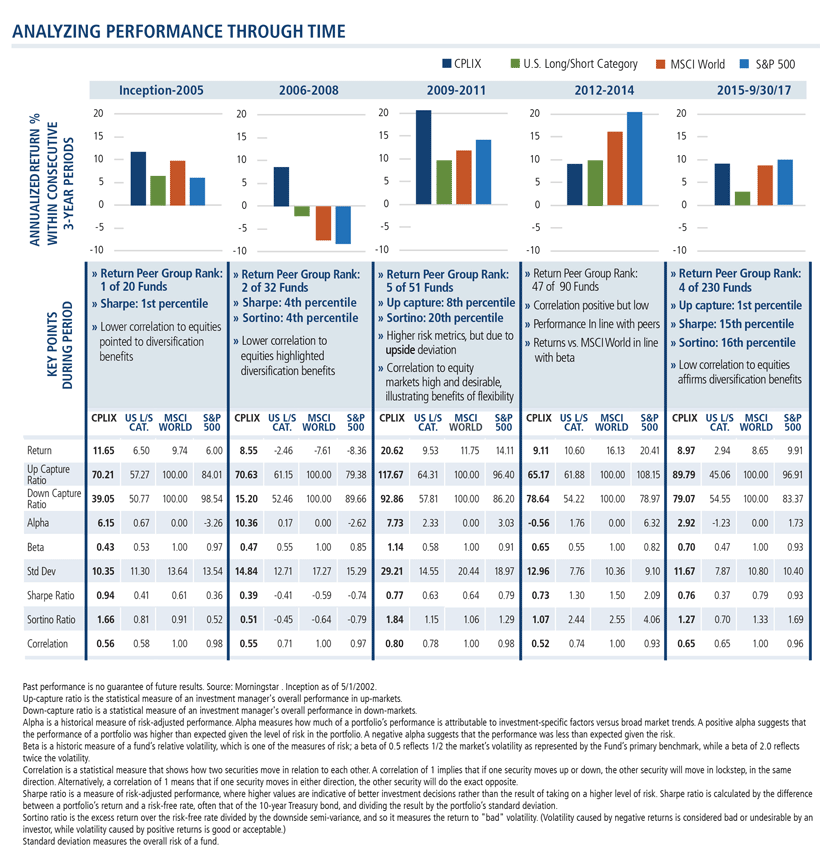
In his conversations with advisors, Grant has learned that many assume that a strong 15-year track record is dominated by one or two good years.
An analysis of CPLIX’s track record in consecutive three-year periods, as shown below, illustrates its consistency, with the fund meeting its objectives both against its benchmarks and other long/short equity funds (and see this post). Also relevant is the continuity of the management team—Grant has managed the fund since its inception with the same consistent process and team members (see sidebar).
Investment Flexibility
“For the advisor community, success is about generating returns for your clients while avoiding the big mistakes. Big mistakes can include increasing your equity exposure at just the wrong moment or not increasing your exposure at just the right moment,” says Grant.
CPLIX historically has been able to produce strong returns in part because of its ability to go long in regions, sectors and companies that are expected to outperform or short in regions, sectors and companies expected to underperform.
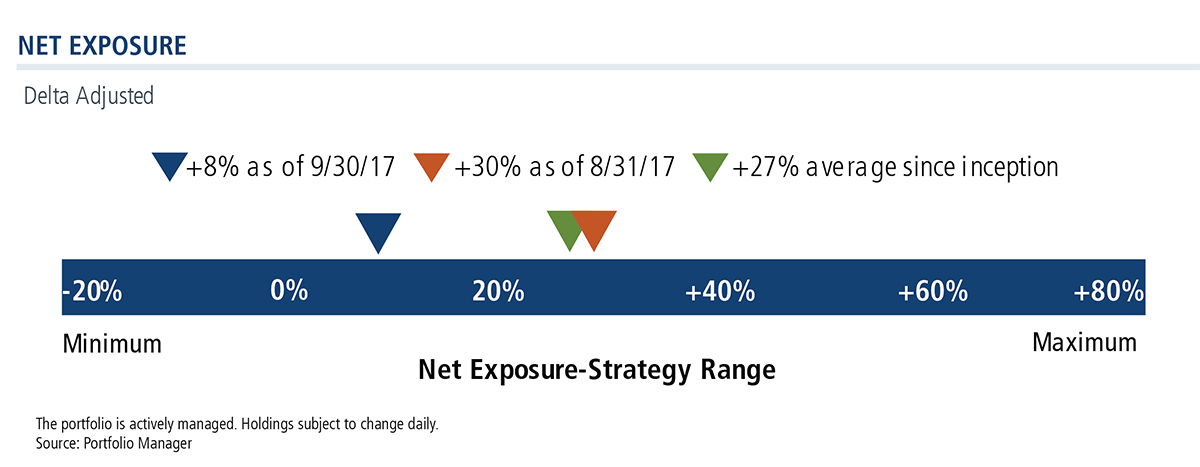
Exposure limits have been in place largely since the fund’s inception in 2002 and are consistent with what has been achieved: keeping up with markets when they’re rising while minimizing drawdowns when markets are falling. (For more, see this recent post.)
Over the 15 years since the fund’s inception, the fund has achieved its returns with an average net exposure of approximately 27%.
Returns are not just the outcome of skills, as Grant likes to say, but the outcome of skills plus opportunity.
The fund’s long-term success also reflects its ability to allocate assets across the entire equity universe. Its flexibility has allowed for all investment styles, market caps and geographic regions depending on the market environment.
Where To Find Historical Performance Data
Here’s where you’ll find the fund’s performance data since 2002:
- Third-party databases (e.g., Lipper, Bloomberg). Unfortunately, you won’t find it in Morningstar, which recently opted to discontinue including hedge fund historical performance alongside mutual fund performance.
- Calendar year returns for the fund A shares at NAV on the fund profile page
- In the prospectus (download here)
- For advisors only: Ask your Calamos Investment Consultant for an Excel spreadsheet of monthly returns for Class A, I and C shares dating back to May 2002. Most investment research and portfolio analytical software systems have import functions and you can simply import the historical data and proceed with your research.
For more information on CPLIX, CMNIX or the Half Caff combination, talk to your Calamos Investment Consultant at 888-571-2567 or caminfo@calamos.com.
Before investing, carefully consider the fund’s investment objectives, risks, charges and expenses. Please see the prospectus and summary prospectus containing this and other information which can be obtained by calling 1-866-363-9219. Read it carefully before investing.
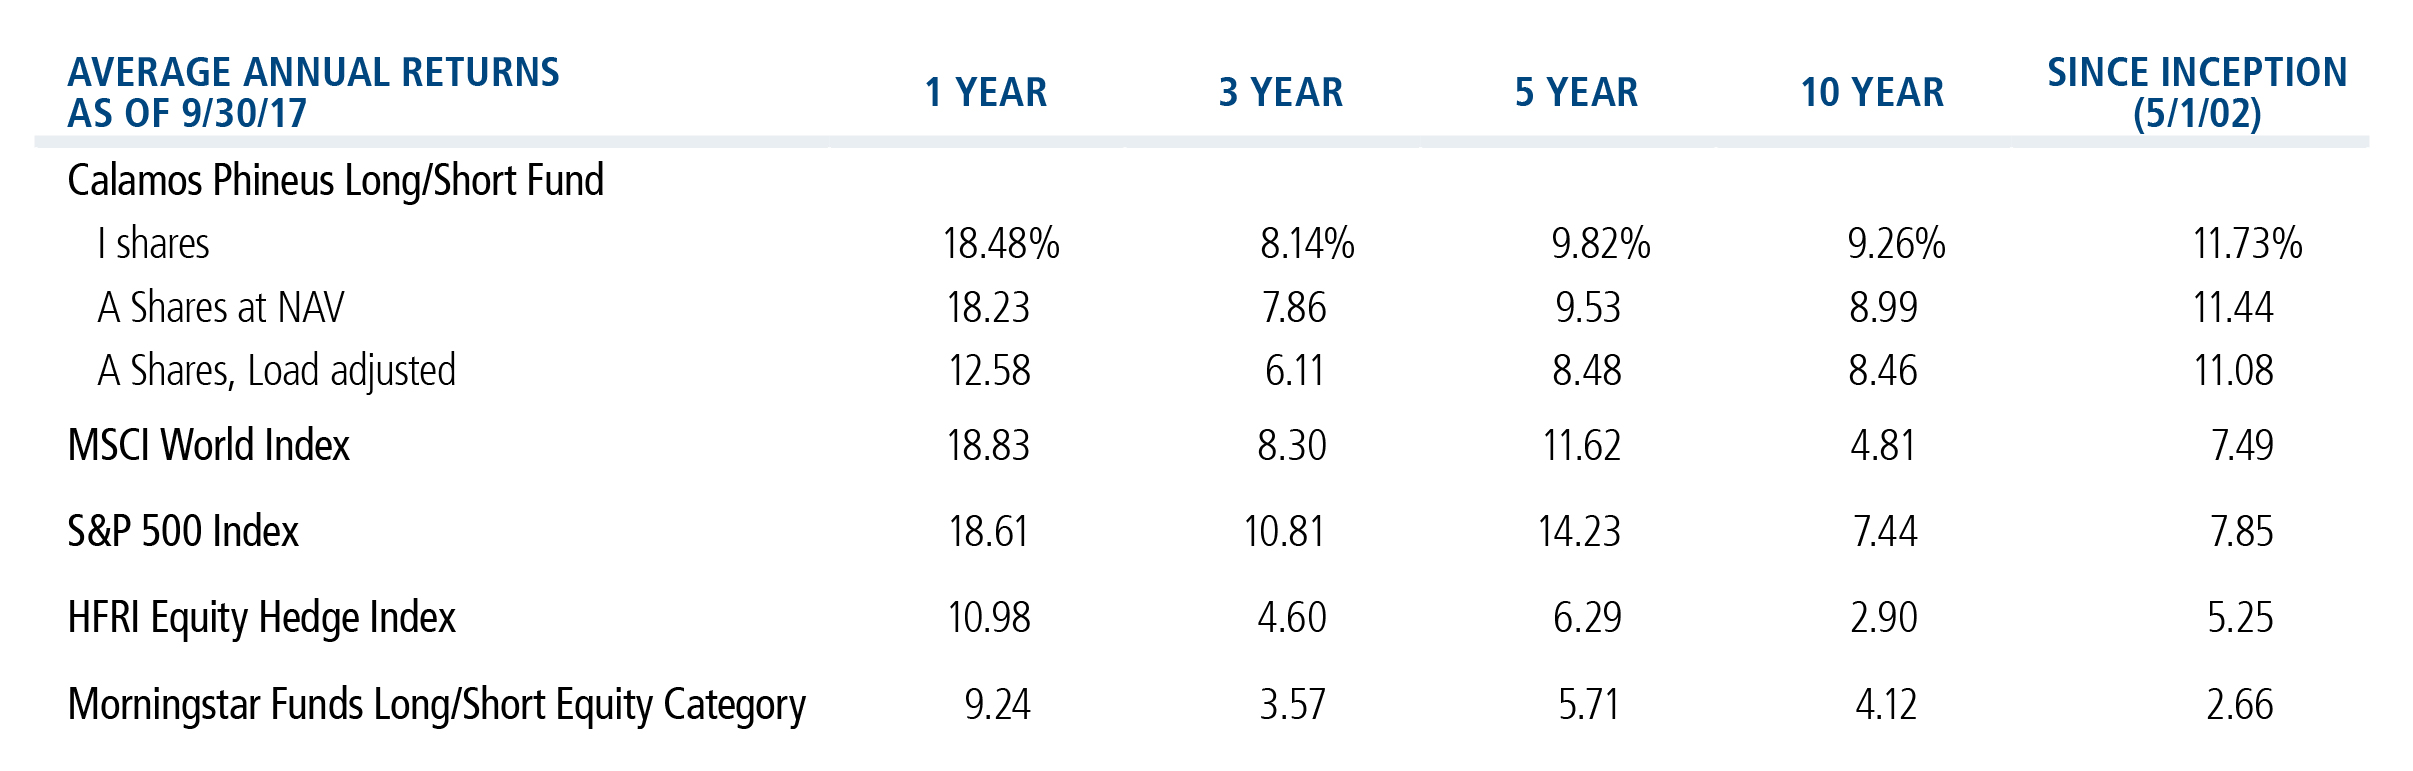
Performance data quoted represents past performance, which is no guarantee of future results. Current performance may be lower or higher than the performance quoted. The principal value and return of an investment will fluctuate so that your shares, when redeemed, may be worth more or less than their original cost. Performance reflected at NAV does not include the Fund’s maximum front-end sales load of 4.75%. Had it been included, the Fund’s return would have been lower. For the most recent month end performance information visit www.calamos.com.
The performance shown for periods prior to 4/6/16 is the performance of a predecessor investment vehicle (the “Predecessor Fund”). The Predecessor Fund was reorganized into the Fund on 4/6/16, the date upon which the Fund commenced operations. On 10/1/15 the parent company of Calamos Advisors, purchased Phineus Partners LP, the prior investment adviser to the Predecessor Fund (“Phineus”), and Calamos Advisors served as the Predecessor Fund’s investment adviser between 10/1/2015 until it was reorganized into the Fund. Phineus and Calamos Advisors managed the Predecessor Fund using investment policies, objectives, guidelines and restrictions that were in all material respects equivalent to those of the Fund. Phineus and Calamos Advisors managed the Predecessor Fund in this manner either directly or indirectly by investing all of the Predecessor Fund’s assets in a master fund structure. The Predecessor Fund performance information has been adjusted to reflect Class A and I shares expenses. However, the Predecessor Fund was not a registered mutual fund and thus was not subject to the same investment and tax restrictions as the Fund. If it had been, the Predecessor Fund’s performance may have been lower.
The principal risks of investing in the Fund include: equity securities risk consisting of market prices declining in general, short sale risk consisting of potential for unlimited losses, foreign securities risk, currency risk, geographic concentration risk, other investment companies (including ETFs) risk, derivatives risk, options risk, and leverage risk.
The MSCI World Index is a market capitalization weighted index composed of companies representative of the market structure of developed market countries in North America, Europe and Asia/Pacific region.
The S&P 500 Index is generally considered representative of the U.S. stock market.
The HFRI Equity Hedge Index consists of funds where portfolio managers maintain long and short positions in primarily equity and derivative securities.
The Morningstar Long/Short Equity Category funds take a net long stock position, meaning the total market risk from the long positions is not completely offset by the market risk of the short positions. Total return, therefore, is a combination of the return from market exposure (beta) plus any value-added from stock-picking or market-timing (alpha).
Calendar year returns measure net investment income and capital gain or loss from portfolio investments for each period specified. Average annual total return measures net investment income and capital gain or loss from portfolio investments as an annualized average. All performance shown assumes assumes reinvestment of dividends and capital gains distributions. The Fund also offers Class C Shares, the performance of which may vary. In calculating net investment income, all applicable fees and expenses are deducted from returns.
The offering price for Class I shares is the NAV per share with no initial sales charge. There are no contingent deferred sales charges or distribution or service fees with respect to Class I shares. The minimum initial investment required to purchase each Fund’s Class I shares is $1 million. Class I shares are offered primarily for direct investment by investors through certain tax-exempt retirement plans (including 401(k) plans, 457 plans, employer-sponsored 403(b) plans, profit sharing and money purchase pension plans, defined benefit plans and non qualified deferred compensation plans) and by institutional clients, provided such plans or clients have assets of at least $1 million. Class I shares may also be offered to certain other entities or programs, including, but not limited to, investment companies, under certain circumstances.
Unmanaged index returns assume reinvestment of any and all distributions and, unlike fund returns, do not reflect fees, expenses or sales charges. Investors cannot invest directly in an index.
NOT FDIC INSURED | MAY LOSE VALUE | NO BANK GUARANTEE
800851 10/17